
.
This experimental post revisits the question whether all grammar schools are effective in closing attainment gaps between disadvantaged students and their peers.
Ministers have asserted as much in recent speeches, but they are relying on a single piece of research, now more than a decade old. The Education Policy Institute has countered with qualified statistical comparisons between selective and comprehensive schools
This post explores what can be deduced about the effectiveness of individual grammar schools from published School Performance Tables data. It is divided into three sections:
- Commentary on the evidence behind the Government’s statement and on the Education Policy Institute’s counter-analysis.
- Experimental analysis of 2015 Performance Tables data relating to several different headline measures.
- Comparison between these new findings and my previous Performance Tables analysis covering the period from 2011 to 2013.
The middle section is is very much a work in progress and I welcome your constructive feedback.
.
The Government versus the Education Policy Institute
.
The government’s position
During her speech at the Conservative Party Conference, Secretary of State Justine Greening asserted that:
‘Grammar schools have a track record of closing the attainment gap between children on free school meals and their better off classmates.
That’s because in grammars, those children on free school meals progress twice as fast as the other children, so the gap disappears.’
This must be derived from the statement in the green paper, ‘Schools that work for everyone’:
‘Some studies have found that selective schools can be particularly beneficial for pupils on lower incomes who attend them. For example, one study reported that the educational gain from attending a grammar school is around twice as high for pupils eligible for free schools meals, compared to the overall impact across all pupils.’ (p23)
The footnote reveals that the study in question is ‘The results of 11 Plus selection: an investigation into equity and efficiency of outcomes for pupils in selective LEAs’ by Atkinson, Gregg and McConnell, published in 2004 and cited in a later 2008 meta-study for the Sutton Trust.
No further supporting evidence has been forthcoming to date.
According to the summary in the meta-study, the 2004 research used value added measures to compare the performance of FSM and non-FSM students.
For FSM students it found ‘the grammar school effect to be substantial at about 7 to 8 grade points’ whereas ‘the effect on those not eligible for FSM was similar to grammar schools as a whole, at around 3 to 5 grade points’.
This has been translated into ‘progress[ing] twice as fast’ although, strictly speaking, it describes the greater distance travelled from a given starting point rather than the relative speed of that journey.
Moreover, the figures above allow for the possibility of even better relative outcomes for FSM students (7 or 8 grade points versus 3 grade points) but relatively worse outcomes too (7 grade points versus 4 or 5 grade points; 8 grade points versus 5 grade points). In the worst case scenario their advantage is only two grade points.
The conclusion in the Sutton Trust’s meta-study is very much more guarded:
‘We find that pupils eligible for FSM appear to suffer marginally less educational disadvantage if they attend grammar schools. The difference is equivalent to about one-eighth of a GCSE grade; although this is statistically significant, it is certainly not large. It also seems possible that FSM pupils in grammar schools may typically be quite different from FSM pupils as a whole in ways that are not well measured, so we should be cautious about interpreting this as a strong endorsement of grammar schools.’
It should be noted that this is comparing the performance of FSM pupils in grammar schools and elsewhere: it is not comparing FSM and non-FSM performance within grammar schools. The two findings are not strictly comparable.
.
Education Policy Institute counter-analysis
The recent Education Policy Institute report ‘Grammar schools and social mobility’ (September 2016) follows in these footsteps.
Initially it draws on 2015 School Performance Tables data on attainment gaps between FSM and other pupils across all selective schools:
- 92.5% of FSM students achieved the 5+ A*-CEM measure, compared with 96.8% of other students, giving a gap of 4.3 percentage points.
- 58.7% of FSM students achieved the EBacc, compared with 69.9% of other learners giving a gap of 11.2 percentage points.
- FSM students achieved +11.2 on a KS2-4 Best 8 VA measure, while other students achieved +25.1, giving a gap of 13.9 points.
None of these statements endorses the claim that grammar schools have a strong track record of closing attainment gaps. The gaps on the second and third measures are particularly substantial.
The report repeats the first calculation, this time including only those in the top quartile by prior attainment at the end of KS2.
This is a more selective sample than is caught by the ‘high attainer’ distinction in the 2015 Performance Tables, which accounts for some 35% of learners in the GCSE cohort in all state-funded schools and some 91% of that cohort across all state-funded selective schools.
The effect is to reduce the FSM gap significantly, from 4.3 percentage points to 1.7 points (96.2% FSM versus 97.9% non-FSM). It is presumably attributable to the influence of selection by ability as opposed to selection by prior attainment.
So FSM performance jumps more than non-FSM performance (3.7 percentage points higher versus 1.1 points higher) because a relatively larger proportion of the FSM grammar school population is outside the top quartile by prior attainment.
The report goes on to apply ‘propensity score matching techniques’ to compare the performance of pupils with similar characteristics in selective and other schools across 2014 and 2015 combined.
At national level it identifies a ‘grammar school bonus’ for all those who attend selective schools of +2.4 grades across eight GCSEs (+0.3 grades per subject). But for FSM pupils this increases to +3.9 grades (+0.5 grades per subject).
Echoing the note of caution in the Sutton Trust report, it attributes some of this difference to the ‘exceptional nature’ of the FSM cohort:
‘The vast majority of FSM pupils are spread across the attainment distribution range. So FSM pupils who attain highly enough to attend a grammar school are, by definition, exceptional. There may also be other external factors which have contributed to the high performance of this small group of children, including parental engagement and high quality teaching. The exceptional nature of these pupils means that we consider the +3.9 grade estimate to be higher than the true effect (i.e. these pupils would have likely outperformed other FSM pupils irrespective of whether they attended a grammar school).’
It prefers an alternative comparison between all grammar schools and the top 25% of comprehensives based on (unspecified) ‘value added progress measures’.
According to this there is:
‘no benefit of attending a grammar school for high-attaining pupils in their ‘best 8’ GCSE grades [sic]’
This applies to FSM and non-FSM pupils alike.
The additional advantage to FSM students has disappeared. It is not clear what the impact of the ‘exceptional nature’ of the FSM high attainer cohort has been on this calculation. Is it felt to exactly the same degree in the better comprehensive schools and in selective schools alike?
The report admits there might be gains for FSM students attending grammar schools in relation to their A level grades, university entry (and presumably higher education destinations?) or ‘the difficulty of GCSE subject studied’, but these are not explored. It is not clear whether the latter would include entry to and achievement of the EBacc.
This alternative comparison is fundamentally unfair because it rests on the assumption that, while there is substantial variability in the performance of comprehensive schools, there is no equivalent variability in the performance of grammar schools. But the analysis below shows that this is far from true.
It would be much fairer to compare the top 25% of comprehensives and the top 25% of grammar schools according to the same value added progress measures.
It also seems strange that the government and the EPI alike are relying exclusively on an old-style FSM/non-FSM distinction. Both should be foregrounding comparisons between disadvantaged students (‘ever-6’ FSM and in care) and all other students.
That should be the default measure, at least until we have a working definition of ‘just getting by’.
.
Performance Tables analysis
Earlier work: 2011 to 2013 inclusive
In my recent review of the green paper I drew attention to an earlier post – ‘How well do grammar schools perform with disadvantaged pupils?’ (December 2014)
This used data in the 2013 Performance Tables to compare the attainment of pupil premium-eligible learners in selective schools with that of their peers.
It relied primarily on three year averages – for 2011, 2012 and 2013 combined – to minimise the distorting effect of the small disadvantaged populations found in most grammar schools.
It drew mainly on three old headline measures: 5+A*-CEM, at least expected progress in English and at least expected progress in maths.
It concluded:
‘While there is a relatively large group of consistently high performers, roughly one in five grammar schools is a cause for concern on at least one of the three measures. Approximately one in ten is performing no more than satisfactorily across all three…
A handful of grammar schools are recording significant negative gaps between the performance of disadvantaged students and their peers.’
This seems to me important. There is too often a tendency to regard the selective secondary sector as homogenous and of universally high quality. But this evidence suggests that there is a sizeable rump of selective schools that is underperforming relative to the others. This underperformance extends to their record in closing attainment gaps.
.
New findings: 2015 data, including some 2013-15 aggregate data
The new analysis is experimental and I want to expose it to your scrutiny.
It relies on comparison between schools’ different ‘success rates’ in achieving various headline measures with their small pupil premium-eligible populations on one hand – and with all other students on the other.
It rests on some prior assumptions which I invite you to share, namely:
- The optimal outcome is parity with a perfect 100% success rate for both groups.
- Parity that falls slightly short of perfection is also a positive outcome. So is a moderate ‘reverse gap’ where the smaller pupil premium cohort is outperforming the larger more advantaged group.
- But a substantial reverse gap, particularly if it reaches 10 percentage points or more, raises the distinct possibility that the focus on disadvantaged students has become disproportionate.
- Similarly, a small ‘excellence gap’, where the larger population has a slightly higher success rate than the smaller pupil premium group, is acceptable – probably not much more than a statistical anomaly.
- But a substantial excellence gap, of ten percentage points or higher, suggests that the small pupil premium group are underachieving compared with their more advantaged peers. The bigger the gap, the bigger the problem.
- If there are substantial excellence gaps on more than one headline measure simultaneously – and particularly if there are such gaps on more than two measures – we should be concerned that the school may be under-performing.
- It is not impossible that schools might suffer from a single ‘bad year’, but a history of multiple excellence gaps over two years or more is a strong indicator of underperformance.
Whereas the earlier analysis relied exclusively on three-year aggregates, I decided to adopt a two-stage process for this follow-up study.
The initial stage uses 2015 data only to identify a subset of grammar schools with questionable performance in that year.
The very small disadvantaged cohorts at most grammar schools make these findings vulnerable to distorting effects. If just one of six students falls short on any particular performance measure, the success rate will drop from 100% to 84%. Just one ‘bad day’ can have a dramatic impact.
But, set against this, one might reasonably argue that, other things being equal, grammar schools should find it comparatively easier to generate perfect 100% success rates with their very small disadvantaged populations. In a cohort ten or twenty times larger the probability of ‘bad days’ is radically increased, even though the effect will be much less pronounced.
I have only introduced the ‘performance over time’ data for 2013-2015 as a second stage, to establish whether poor performance by some grammar schools in 2015 was or was not a ‘one off’.
I have used two different formats:
- Separately reported outcomes for 2013, 2014 and 2015 available in the online ‘Compare selected secondary schools’ service for the 5+A*-CEM and EBacc achievement measures.
- Three-year aggregate percentages for expected progress in English and maths which are included in the underlying data.
It would be irresponsible to follow the precedent established above by failing to issue a ‘health warning’ to qualify this analysis.
Some caution is necessary in interpreting these findings, but I believe the evidence base is solid enough to justify the conclusions I have drawn below.
.
The size of disadvantaged GCSE cohorts
In 2015 the 163 grammar schools combined could boast only 1,402 pupil premium-eligible learners in their GCSE cohorts, an average of 8.6 learners per school.
Six schools had a single disadvantaged learner in their GCSE cohort; 49 schools had five or fewer. Only eight grammar schools had 20 or more disadvantaged learners, the most being 32 at Handsworth Grammar School.
The percentage of the 2015 GCSE cohort attracting pupil premium varied between 1% (six schools) and 24% (Stretford Grammar School). Only 22 selective schools had a GCSE cohort in which 10% or more students were eligible. In 77 schools this percentage was 5% or lower. The average was 6.2%
Nationally 8.5% of all grammar school pupils (so not just in the GCSE cohort) received the pupil premium.
Data relating to disadvantaged and all other students is suppressed for the 49 grammar schools with disadvantaged cohorts containing five or fewer students. (One further school returned 0% for the 5+ACEM, English progress and EBacc achievement measures, presumably as a consequence of selecting an ineligible IGCSE in English. It too has been omitted from the calculations below.)
The remaining grammar schools constitute about 70% of the total number. The percentages included in brackets in the commentary below describe the proportions of this sample that achieve various outcomes.
.
5+A*-CEM
Grammar school performance on this measure is predictably strong, averaging close to 97% for all students. But, leaving aside the school that returned 0, there were some significant outliers, including Boston Grammar School (78%) and St Joseph’s College (87%).
Looking first at relative success rates for pupil premium and other students:
.
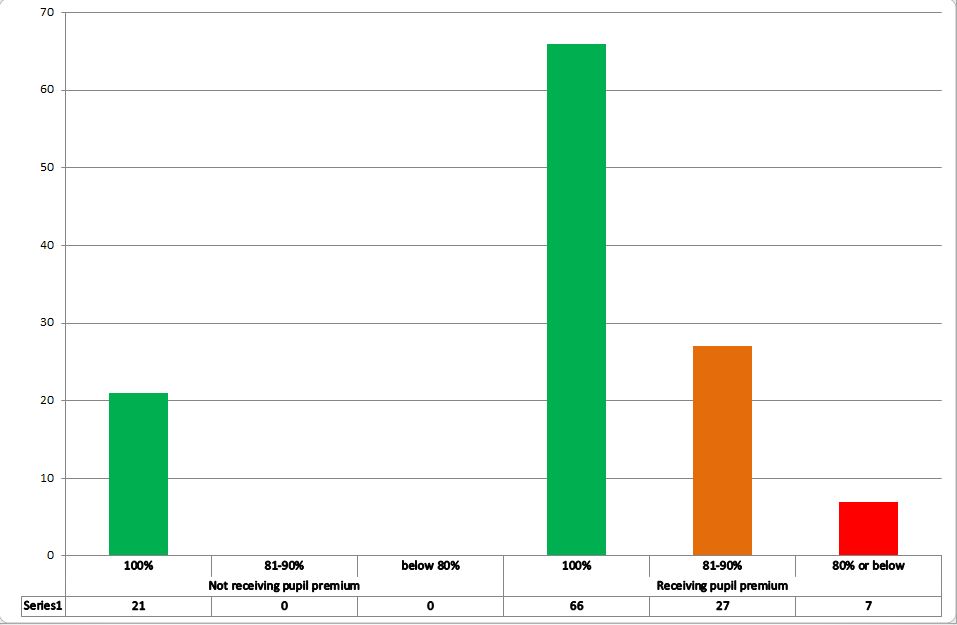
Chart 1: Number of grammar schools achieving different success rates with students receiving and not receiving pupil premium, 5+A*-CEM measure, 2015 GCSE cohort
.
Only 21 schools (19%) achieved a 100% success rate on this measure amongst those students not attracting pupil premium. Twenty schools (18%) came in at between 91% (the lowest recorded) and 95%. (Results for Boston and St Joseph’s were unfortunately suppressed.)
This is good, but not quite as good as it should be.
It ought really to be a default expectation of selective schools that, other than in the most exceptional circumstances, all their students achieve at least five GCSEs at grade C including English and maths.
In 2015 91.1% of all high attainers in all state-funded schools achieved this outcome.
Success rates for disadvantaged learners were much more variable. A commendable 66 grammar schools (58%) managed perfect 100% records. But there is also a ‘long tail of underachievement’, with as many as 34 schools (30%) recording a success rate of 90% or lower.
Of these, seven are at 80% or below. The poorest performers are Queen Elizabeth Grammar School Penrith (50%), St Anselm’s College (68%) and Chatham Girls’ Grammar School (70%).
Turning to the size of excellence and reverse gaps:
.

Chart 2: Size and direction of gaps between grammar school success rates for students receiving and not receiving pupil premium, 5+A*-CEM measure, 2015 GCSE cohort
.
There are:
- 20 schools (18%) where the success rates for pupil premium and other students are identical. In all but two of these the success rate is 100% on both counts.
- 49 schools (43%) where the success rate for the small cohort of disadvantaged students exceeds that for the much larger group of other students. (a ‘reverse gap’.) In most cases such gaps are small, the largest being nine percentage points (100% versus 91% at Spalding High School).
- 44 schools (39%) where the success rate for other students is higher than that for pupil premium students. (an ‘excellence gap.) Such gaps tend to be significantly larger. There are 19 schools (17%) where the gap is 10-19 percentage points and four (4%) with a gap of 20 percentage points or more. The largest recorded excellence gaps are 46 percentage points at Queen Elizabeth Grammar School Penrith (50% v 96%), 36 points at St Anselm’s College (68% v 94%), and 22 points at Chatham Girls’ Grammar School (70% v 92%) and at Norton Knatchbull School (75% v 97%).
.
At least expected progress in English
Grammar school performance on this measure is not quite so good, averaging a little over 93% for all students in 2015.
The poorest performers – other than the school returning 0 – were Chatham Grammar School for Girls (72%), Handsworth Grammar School (77%), The Queen Elizabeth High School Gainsborough (77%), Dane Court Grammar School (78%), Maidstone Grammar School (79%) and Sir Roger Manwood’s School (80%). Nationally 82.3% of all high attainers achieved this benchmark
Several more schools are only a few percentage points ahead of those above.
Rather too many selective schools were failing to secure the minimum three levels of progress for all their students. Far too many of those with L5 KS2 prior attainment must have been achieving GCSE grade C at best.
Regardless of the shortcomings of the ‘levels of progress’ methodology, this is heavily redolent of underachievement. We are promised that Progress 8 will eradicate the problem.
Comparing success rates for pupil premium and other students:
.
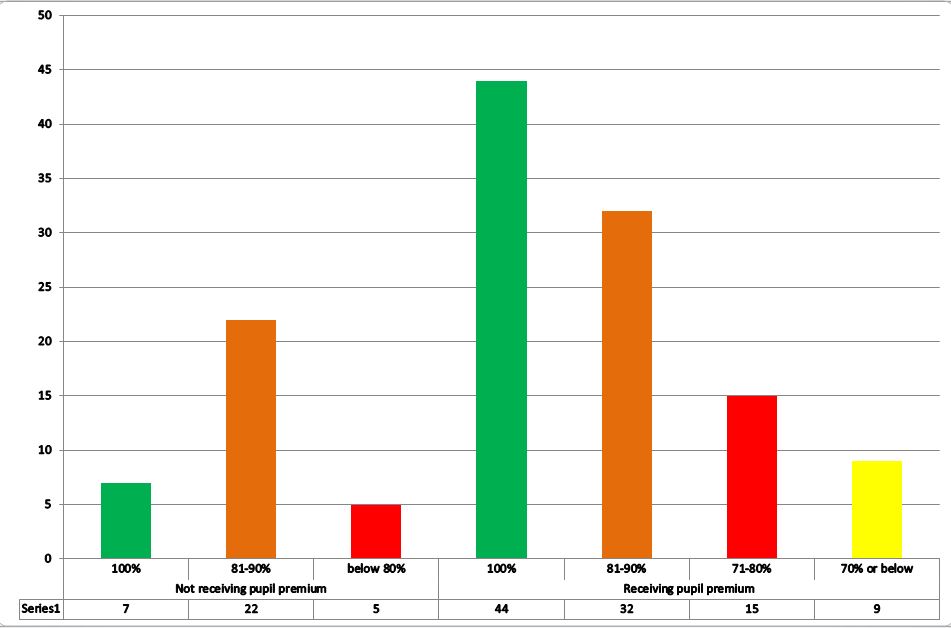
Chart 3: Number of grammar schools achieving different success rates with students receiving and not receiving pupil premium, at least expected progress in English measure, 2015 GCSE cohort
.
There is rather greater variability for non-disadvantaged learners on this measure. Just seven schools (6%) achieved a perfect 100%. Twenty-seven schools (24%) had a success rate of 90% or lower, five of which recorded 80% or less.
But success rates for the much smaller cohorts of disadvantaged students are still more variegated.
At one extreme, 44 schools (39%) recorded a perfect 100%. At the other, nine schools (8%) achieved 70% or below, the poorest being Carre’s Grammar School (50%) and Chatham Girls’ Grammar School (53%).
A total of 24 schools (21%) had a success rate of 80% or less; a total of 56 (50%) had a success rate of 90% or lower.
Moving on to reverse and excellence gaps –
.
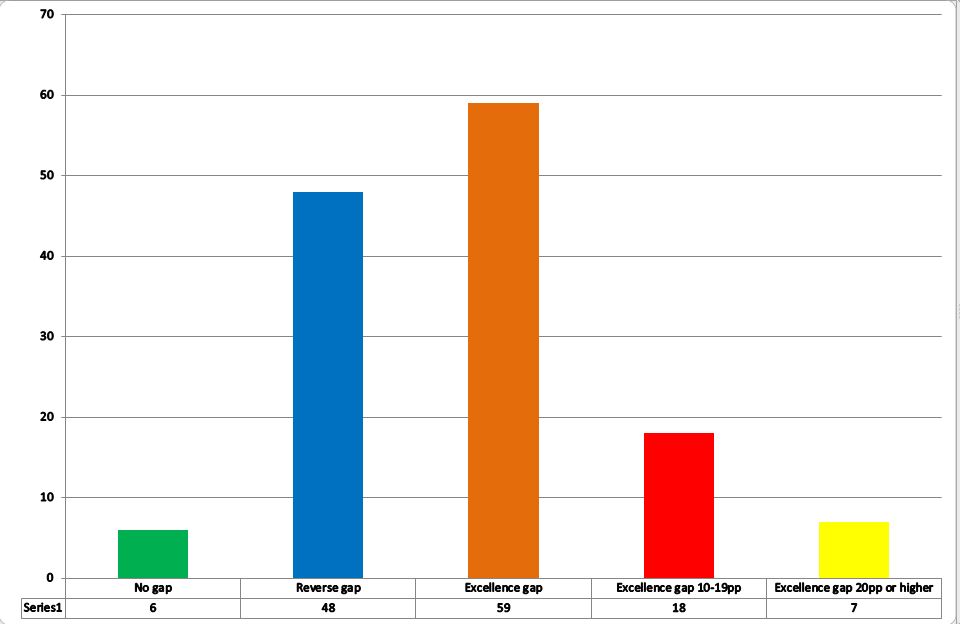
Chart 4: Size and direction of gaps between grammar school success rates for students receiving and not receiving pupil premium, at least expected progress in English measure, 2015 GCSE cohort
.
There are:
- 6 schools (5%) with identical success rates for advantaged and disadvantaged learners, five of them recording 100% across the board.
- 48 schools (42%) with a relatively better success rate for disadvantaged learners, though these gaps again tend to be relatively small. Fourteen schools recorded a gap of five percentage points or more, but only two (Dover Grammar School for Boys – 11 points – and Southend High School for Boys – 10 points) were pushing into double figures.
- 59 schools (52%) have a better success rate with their advantaged learners than with their disadvantaged learners. Again these gaps tend to be much more pronounced. There are 18 schools (16%) with a gap of 10-19 percentage points and seven (6%) with a gap of 20 percentage points or more. The most substantial gaps are 39 percentage points (89% v 50%) at Carre’s Grammar School, 27 points (97% v 70%) at Lancaster Royal Grammar School and 25 points (92% v 67%) at Queen Elizabeth Grammar School Penrith.
.
At least expected progress in maths
Grammar schools performed slightly better on this measure than on the comparable English progress measure, with an average success rate of just over 96% for all students.
The poorest performers are: Queen Elizabeth Grammar School Penrith (71%), Skegness Grammar School (76%), The Boston Grammar School (79%), Mayfield Grammar School Gravesend (79%) and The Harvey Grammar School (80%). Several other schools achieved success rates in the low-to-mid 80s. Nationally, 82.9% of high attainers achieved this mark.
So, despite the higher average success rate, there were broadly as many grammar schools struggling with progress in maths as there struggling with progress in English.
Considering differential success rates for disadvantaged and other students:
.

Chart 5: Number of grammar schools achieving different success rates with students receiving and not receiving pupil premium, at least expected progress in maths measure, 2015 GCSE cohort
.
Eleven schools recorded a perfect 100% amongst their non-disadvantaged students. At the other extreme, a total of 19 were at 90% or below, four of those at 80% or below.
The same pattern occurs, with much greater variability in the performance of the smaller disadvantaged cohorts. Fifty-four schools (48%) achieved a perfect 100% record. Contrastingly, there were ten schools with a success rate of 70% or lower, 11 with a success rate of 71-80% and 26 with a success rate of 81-90%.
The poorest performers were Queen Elizabeth Grammar School Penrith (17%), West Kirby Grammar School (57%) and Norton Knatchbull School (58%).
.
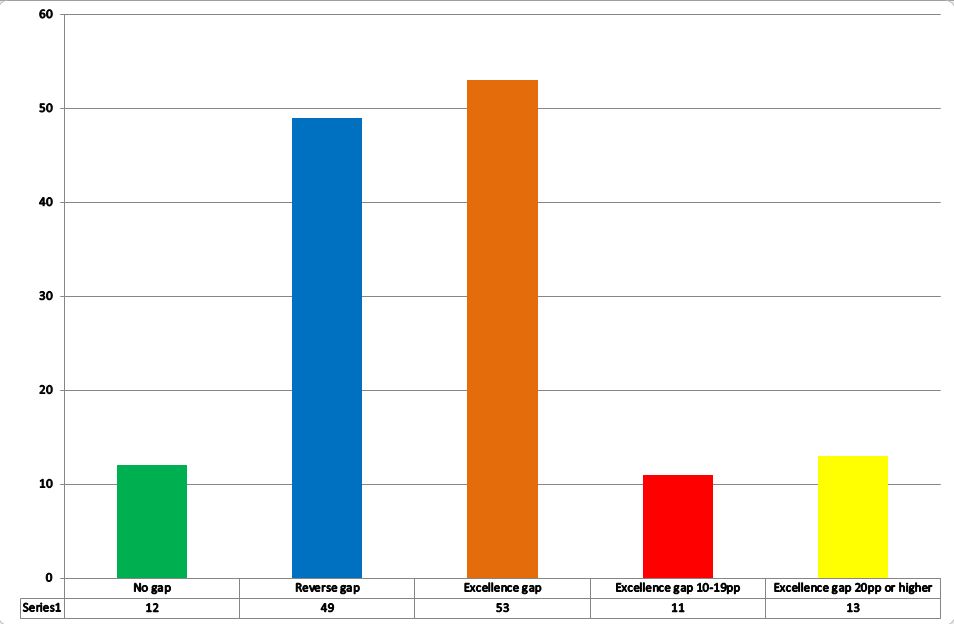
Chart 6: Size and direction of gaps between grammar school success rates for students receiving and not receiving pupil premium, at least expected progress in maths measure, 2015 GCSE cohort
.
Turning to the gaps, there were:
- 12 schools (11%) with identical success rates for advantaged and disadvantaged learners, all but two recording a perfect 100% on both counts.
- 49 schools (43%) recording a better success rate with their disadvantaged learners. These gaps are again comparatively small. A total of 20 schools generated a gap of five percentage points or higher, four of them between 12 and 14 percentage points, the outlier being Skegness Grammar School (14 points).
- 53 schools (47%) had a relatively better success rate with their non-disadvantaged learners. Twenty-four schools (21%) recorded an attainment gap of ten points or higher, 13 of those (11%) having gaps of 20 points or more. The most pronounced gaps were 57 points at Queen Elizabeth’s, Penrith (74% v 17%), 37 points at West Kirby Grammar School (94% v 57%), 32 points at Chatham Girls’ Grammar School (95% v 63%) and 31 points at Norton Knatchbull School (89% v 58%).
Achieving EBacc
Overall, just below 70% of all grammar school pupils achieve the EBacc. Nine schools record 0 and one more stands at 1%.
Otherwise some of the lowest recorded success rates are at Chelmsford County High School for Girls (11%); RGS High Wycombe (12%); Devonport High School for Boys (15%); Boston High School (28%); Dover Grammar School for Boys (31%); and Stretford Grammar School (34%). Some of these results may be attributable to the use of ineligible IGCSEs.
At the other extreme, eight schools exceed 95% success and one school achieves a perfect 100%.
The national success rate for high attainers stands at 52.3%, so selective schools are further ahead on this measure than on the old headline measures above. However there is much greater variability in performance between different grammar schools.
Looking at success rates for pupil premium and other students –
.
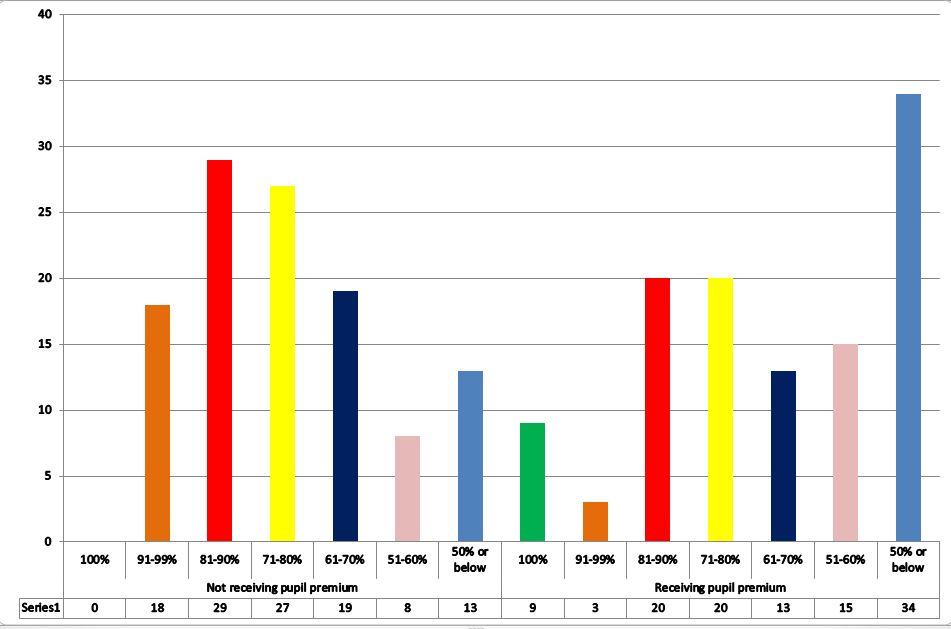
Chart 7: Number of grammar schools achieving different success rates with students receiving and not receiving pupil premium, achieving EBacc measure, 2015 GCSE cohort
.
No school for which data is available achieved a 100% EBacc success rate with its non-disadvantaged learners, though seven schools were at 95% or above, two of them reaching 99%.
There was significant variance however with: 18 schools between 91-99%; 29 schools between 81-90%; 27 schools at 71-80%; 19 schools at 61-70%; eight schools at 51-60% and 13 schools at 50% or below, five of which stood at zero (including the one which also had zero returns for 5+A*-CEM and expected progress in English).
Turning to the smaller disadvantaged cohorts, nine schools recorded a 100% success rate. There was again significant variance with: three schools at 91-99%; 20 schools at 81-90%; 20 schools at 71-80%; 13 schools at 61-70%; 15 schools at 51-60%; and 34 schools at 50% or below, the same five of those at zero.
.

Chart 8: Size and direction of gaps between grammar school success rates for students receiving and not receiving pupil premium, achieving EBacc measure, 2015 GCSE cohort
.
The analysis of gaps reveals:
- Only two schools where the non-disadvantaged and pupil premium success rates are a perfect match, excluding those with zero returns.
- 28 schools (25%) where the success rate for pupil premium learners was better than for non-disadvantaged learners. In 18 schools the variance was five percentage points or greater, in eight it was 10 percentage points or greater and in four it was 20 percentage points or greater. The outlier is Poole Grammar School, with a 37 point variance (100% versus 63%).
- In the remaining 79 schools (so 70% of the sample) the success rate for advantaged learners exceeds that for disadvantaged learners. There is a gap of 10 points or higher in 24 schools (21%), of 20 points or higher in 21 schools (19%) and of 30 points or higher in eight schools (7%). The biggest gaps are 60 points at Queen Elizabeth Grammar School Penrith (77% v 17%), 40 points at Sale Grammar School (76% v 36%) and 40 points at West Kirby Grammar School (69% v 29%).
.
Attainment 8
The supporting data includes only 47 grammar schools with Attainment 8 results. The overall average score is a little below 70. The lowest average score is 62.3 and the highest 76.0.
Seventeen of the 47 have their results suppressed for non-disadvantaged and pupil premium populations, leaving a sample of just 30 schools (18% of all grammar schools).
The average score for non-disadvantaged students is just over 69, with the lowest being 62.6 (Oakwood Park Grammar School) and the highest 75.4 (Tiffin School).
The average score for pupil premium students is just over 66, with the lowest being 55.5 (St Anselm’s College) and the highest 75.3 (Wallington High School for Girls).
Only three schools (10%) have an average Attainment 8 score that is higher for pupil premium students: 4.1 points higher at Gravesend Grammar, 1.5 points higher at Wallington High School for Girls and 0.7 points higher at Queen Mary’s Grammar School.
In the remaining 27 schools (90%) the reverse is true. In two schools the gap is less than one point, in five more it is two points or less.
But in seven schools there is a gap of five points or more: West Kirby Grammar (8.2 points); St Anselm’s College (8.1 points); Sutton Coldfield Grammar School for Girls and Kesteven and Grantham Girls’ Grammar School (5.9 points); Wirral Grammar School for Boys (5.6 points); The Crypt School (5.3 points); and Wirral Grammar School for Girls (5.1 points).
.
Progress 8
Amongst the 47 schools with Progress 8 results the overall average score is slightly above +0.5. The lowest score is +0.11 (Oakwood Park Grammar School) and the highest +0.9 (Wycombe High School and Nonsuch High School for Girls).
Amongst the 30 without suppressed results, the average score for pupil premium students is around +0.27 while for non-disadvantaged students it is almost +0.51.
For pupil premium students the lowest score is -0.55 (West Kirby Grammar School). Seven schools have scores below 0. The best outcome is +0.98 (Nonsuch).
For advantaged students the lowest score is +0.14 (Beths Grammar School) and the best +0.91 (Wycombe High School.
The results suggest significant variance in grammar school performance on this measure and substantial excellence gaps in some schools, but the confidence intervals indicate that these outcomes are not statistically significant.
.
Which schools have the worst records in 2015?
I have excluded Attainment 8 and Progress 8 data from this analysis because the results are confined to a much smaller sample of schools.
.
Excellence gaps and reverse gaps across different headline measures
The analysis above shows that, in 2015, a significant proportion of the grammar schools for which we have data recorded excellence gaps on various headline measures: 5A*-CEM (39% of schools); expected progress in English (52% of schools); expected progress in maths (47% of schools) and achieving EBacc (70% of schools).
Across each measure a broadly comparable proportion – roughly one in five of the sample – returned an excellence gap of between 10 and 19 percentage points.
But some did still worse, sporting excellence gaps in excess of 20 percentage points. Comparatively few schools generated such gaps on the three original headline measures but, on achievement of EBacc, the proportion of schools in this group exceeded the proportion returning smaller gaps of 10-19 points.
The most extreme gaps exceeded 30 percentage points, reaching as high as 57 points in the very worst case.
.
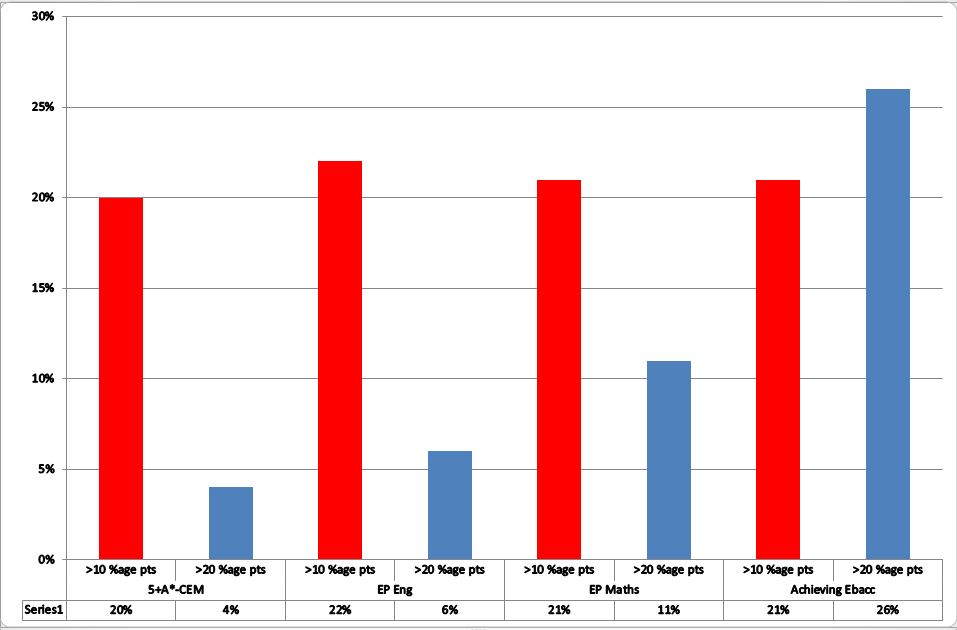
Chart 9: The proportion of grammar schools without suppressed results where 2015 pupil premium attainment gaps on various measures exceed 10 and 20 percentage points
.
Conversely, there were also many schools recording reverse gaps (where pupil premium students were more successful than their non-disadvantaged colleagues) or achieving parity between pupil premium and other students, often by virtue of a 100% success rate.
In the case of the 5+A*-CEM measure and expected progress in maths, the proportion of schools achieving parity or with reverse gaps exceeded the proportion with excellence gaps. The reverse was true for achievement of the EBacc and for expected progress in English.
These results begin to suggest that there might be a the basis for a clear distinction between higher-performing and lower-performing grammar schools, but to what extent are the larger excellence gaps confined to the same schools?
Is there a subset of uniformly poor grammar schools that struggle with closing pupil premium attainment gaps, or do most have a ‘spiky profile’ where some poor results are counterbalanced by others that are rather better?
.
Schools’ aggregate performance in 2015
Taking the four measures for which there is significant data – 5+A*-CEM, expected progress in English and maths and achieving the EBacc – and leaving aside those schools for which data is suppressed, which grammar schools have the most comprehensively poor record of pupil premium excellence gaps?
There are seven schools that have an excellence gap of 10 percentage points or more on all four of these measures. The figures in brackets below give the percentage of pupil premium students in each school’s 2015 GCSE cohorts:
- Chislehurst and Sidcup Grammar School (4%)
- St Anselm’s College (14%)
- Wirral Grammar School for Boys (6%)
- John Hampden Grammar School (5%)
- Maidstone Grammar School for Girls (7%)
- Chatham Grammar School for Girls (16%)
- Queen Elizabeth Grammar School Penrith (5%).
The two last have an excellence gap of 20 percentage points or more on all four measures.
Eight more schools have an excellence gap of 10 percentage points or more on three of the four measures:
- Queen Mary’s High School (17%)
- West Kirby Grammar School (4%)
- Urmston Grammar Academy (7%)
- Parkstone Grammar School (5%)
- Bacup and Rawtenstall Grammar School (7%)
- Carre’s Grammar School (5%)
- Fort Pitt Grammar School (17%)
- The Norton Knatchbull School (8%)
The last has an excellence gap of 20 percentage points or more on each of those three measures.
These 15 grammar schools – about one in seven of those for which we have sufficient data – supply prima facie evidence of failure to close attainment gaps between pupil premium and other students.
The majority have modest pupil premium cohorts, but there are also a few with rather large disadvantaged populations by grammar school standards.
A further 16 schools have a pupil premium attainment gap of 10 points or more on two of the four measures. They also give cause for concern. Taken together these two groups account for some 27% of the sample.
On the face of it, this suggests that the percentage of grammar schools giving potential cause for concern has increased since I last analysed this data. But it is important to establish:
- Whether the performance of these schools in 2013 and 2014 is consistent with their performance in 2015, or whether some at least are at risk of being castigated on the basis of a single year’s ‘rogue results’ and
- Whether the schools giving cause for concern in 2015 were also in that category between 2011 and 2013.
.
How did these schools perform from 2013 to 2015?
There is significant variation in the year-on-year performance of these schools on the 5+A*-CEM and achieving EBacc measures over these three years.
Four of them – Carre’s, John Hampden, Queen Elizabeth’s Penrith and Urmston – have suppressed results for one of the three years.
A few have noticeably ‘spiky profiles’. For example, Chatham Girls’ Grammar School, where 2013 results are strong for EBacc but much weaker for 5+A*-CEM. This picture reverses in 2014, but then in 2015 both there are substantial excellence gaps on both measures.
Similarly, Norton Knatchbull School demonstrates sizeable excellence gaps (above 20 percentage points) on the achieving EBacc measure in 2013 and 2015, but a slight reverse gap in the intervening year.
Several others display more consistent excellence gaps:
- On the 5+A*-CEM measure, Queen Mary’s, St Anselm’s and Wirral Boys record excellence gaps in all three years, while Bacup and Rawtenstall, Fort Pitt (just) and Parkstone show excellence gaps in 2014 and 2015.
- On the achieving EBacc measure, Fort Pitt, Maidstone Girls, Parkstone, Queen Mary’s, West Kirby and Wirral Boys have excellence gaps across all three years, while Chatham Girls, Queen Elizabeth’s Penrith (just), St Anselm’s and Urmston have such gaps in 2014 and 2015.
The picture is rather clearer with the three-year aggregates for expected progress in English and maths.
Only three schools reach parity on one of the two measures (Carre’s in maths, St Anselm’s and West Kirby in English).
Excellence gaps reach 10 or more percentage points in both English and maths at Chatham Girls, Maidstone Girls and Queen Elizabeth’s Penrith. They reach that level in one of the two measures at Bacup and Rawtenstall, Carre’s, Chiselhurst and Sidcup, Parkstone, St Anselm’s, Urmston, West Kirby and Wirral Boys.
.
Are these the same schools that were underperforming from 2011 to 2013?
Has a subset of grammar schools performed consistently poorly over a five –year period, or have some schools improved, only to be replaced by others?
The previous analysis for 2011-13 did not include the achieving EBacc measure.
.
| 2011-13 | 2015 |
| 10+ percentage point excellence gaps on all 3 measures | 10+ percentage point excellence gaps on all 4 measures |
| Simon Langton Grammar School for Boys | Chislehurst and Sidcup Grammar School |
| Dover Grammar School for Boys | St Anselm’s College |
| The Boston Grammar School | Wirral Grammar School for Boys |
| Stratford Grammar School for Girls | John Hampden Grammar School |
| Wilmington Grammar School for Boys | Maidstone Grammar School for Girls |
| St Joseph’s College | Chatham Grammar School for Girls |
| Queen Elizabeth’s Grammar School, Horncastle | Queen Elizabeth Grammar School Penrith |
| 10+ percentage point excellence gaps on 2 out of 3 measures | 10+ percentage point excellence gaps on 3 out of 4 measures |
| Aylesbury Grammar School | Queen Mary’s High School |
| Beths Grammar School | West Kirby Grammar School |
| Devonport High School for Boys | Urmston Grammar Academy |
| Highsted Grammar School | Parkstone Grammar School |
| Loreto Grammar School | Bacup and Rawtenstall Grammar School |
| Plymouth High School for Girls | Carre’s Grammar School |
| Queen Elizabeth Grammar School, Penrith | Fort Pitt Grammar School |
| Simon Langton Girls Grammar School | The Norton Knatchbull School |
| Sir Roger Manwood’s School | |
| Spalding Grammar School | |
| St Anselm’s College | |
| The Crypt School |
.
There is very little overlap between these two lists, with the sole exceptions of Queen Elizabeth’s Penrith and St Anselm’s College.
This may mean that those schools with previously poor records have acted rapidly to improve them, although four of the seven worst performers from 2011-13 have suppressed results in 2015.
As for the remaining three:
- Simon Langton Boys Grammar School has an 8 point excellence gap for expected progress in English, but is otherwise performing better with its disadvantaged cohorts than those from more advantaged backgrounds.
- Dover Boys’ Grammar School has a similarly positive profile, other than in achievement of the EBacc where there is a 12 point excellence gap.
- Queen Elizabeth Grammar School Horncastle has a positive outcome for expected progress in English, a commensurately small excellence gap for expected progress in maths (3 percentage points), parity for achievement of the EBacc and a somewhat larger 8 point excellence gap for 5+ A*-CEM.
Taking the reverse perspective and looking back at how the seven poorest performers in 2015 were doing from 2011-13:
- John Hampden School had a positive profile across the board.
- Chislehurst and Sidcup Grammar School had relatively small excellence gaps for 5+ A*-CEM and expected progress in English.
- Maidstone Girls’ Grammar School had a small excellence gap for expected progress in English and a larger one (8 percentage points) for expected progress in maths.
- Chatham Girls Grammar School had a poor profile for expected progress in maths (11 point excellence gap) but slightly better for 5+ A*-CEM (6 point excellence gap) and expected progress in English (5 point excellence gap)
- Wirral Boys Grammar School had excellence gaps of 18 percentage points for expected progress in English, 9 points for expected progress in maths and 5 points for 5+ A*-CEM.
- St Anselm’s College was perilously close to three excellence gaps of at least ten percentage points (12 points for 5+ A*-CEM, 9 points for expected progress in English and 15 points for expected progress in maths).
- Queen Elizabeth Grammar School Penrith had a smallish excellence gap of 5 points for 5+ A*-CEM, but huge gaps of 28 percentage points for expected progress in English and 31 points for expected progress in maths.
Conclusion
The substantive points I take from this analysis are as follows:
- Judging by the government’s own recent performance tables data, ministers’ assertion that grammar schools ‘have a track record of closing the attainment gap between children on free school meals and their better off classmates’ may be true of some of them, but by no means all.
- The government’s declared evidence base apparently consists of a single research study dating from 2004. The findings are not being accurately reported.
- Counter-analysis by the Education Policy Institute relies heavily on a comparison, based on ‘propensity score matching techniques’, between all grammar schools and the 25% of comprehensives with the best value-added progress measures. A fairer comparison would have drawn on the best quartile of grammar and comprehensive schools alike.
- It is not clear why both parties rely exclusively on FSM/non-FSM comparisons. Why not use the government’s preferred pupil premium/all other distinction which counts in a significantly larger proportion of students? The EPI report does this despite arguing elsewhere that:
‘There is widespread agreement that this is an imperfect measure because it is a binary measure that relies on whether or not parents claim certain income benefits (although the creation of ‘Ever-6’ has helped)… the attainment of a pupil eligible for free school meals can vary significantly depending on the length of time for which he or she has been eligible.’ (p45).
- The incidence, size and frequency of grammar school excellence gaps should help to establish which grammar schools have the track record the government attributes to all of them – and which are potentially underperforming.
- The performance table evidence may be compromised by the very small disadvantaged populations within most grammar schools, but it is possible to argue this point both ways.
- There is significantly greater variance in the performance of grammar schools’ small disadvantaged populations than there is amongst their much larger non-disadvantaged populations. On each headline measure there is a noticeably longer ‘tail of underachievement’ for the former than there is for the latter.
- The 2015 performance table data shows that some grammar schools achieve parity in success rates for pupil premium and other students. More still record ‘reverse gaps’, meaning that their small pupil premium populations outperform their much larger non-disadvantaged populations.
- But, depending on the headline measure, between 39% and 70% of those for which we have data demonstrate excellence gaps, where the small pupil premium populations record lower success rates than their non-disadvantaged peers.
- On each headline measure approximately 20% of the schools for which we have the data record excellence gaps of between 10 and 19 percentage points. Depending on the measure, a further 4-11% record larger excellence gaps in excess of 20 percentage points. In the case of EBacc achievement this second group accounts for 26% of the sample.
- Roughly one in seven of the grammar schools for which we have data record excellence gaps of at least ten percentage points on either three or all four of the selected headline measures. Roughly the same proportion record similar sized excellence gaps on two of the four measures.
- A cross-check against data for the three years from 2013 to 2015 suggests that, while a few schools may be returning ‘rogue results’ in 2015, several more are recording sizeable excellence gaps with some frequency.
- The answer to the question whether these same grammar schools were those underperforming from 2011 to 2013 (so have been doing so across a five year period) is rather less clear. Some schools have moved out of consideration while others have moved in. But a small core has remained a cause for concern.
- At the other extreme, another cadre of grammar schools never falls within scope of such judgements. Some no doubt are escaping scrutiny because their results are consistently suppressed. As long as their GCSE cohorts contain five or fewer pupil premium students they will be safe from this type of analysis.
- Others are more consistently achieving parity – often on the basis of 100% success rates – or else small reverse gaps across most or all of the headline measures. On the basis of this measure they fully justify the government’s confidence in the quality of selective schooling. (Further details will follow in a subsequent post.)
- But we should beware of treating the cadre of 163 selective schools as homogenous. Some perform much better than others. If freedom to expand were made conditional on a strong track record in closing pupil premium attainment gaps – something which ought perhaps to be given serious consideration – several would fall by the wayside.
.
TD
October 2016


Leave a comment