
.
This post reports five-year trends in the admission of disadvantaged students to selective universities, as revealed by the government’s key stage 5 destinations data.
This half decade coincided almost exactly with the lifetime of a government that was strongly committed to social mobility through higher education. What does the destinations data reveal about the progress it made – and what lessons might be drawn by those of us still striving to make a difference?
.
Preamble
In October 2016 DfE published a statistical first release containing provisional key stage 5 destinations data for academic year 2014/15, so creating a five-year sequence of data stretching back to 2010/11.
The release – Destinations of KS4 and KS5 pupils: 2015 (provisional) – received scant attention from the education commentariat, coinciding as it did with the publication of two other bulletins containing provisional 2016 GCSE and A level results.
But this dataset is about to become very much more significant in the schools and post-16 sectors since destination is a headline measure in the next iteration of the 16-18 performance tables, due for publication in January 2017.
According to the statement of intent the tables will include details of progression to selective higher education destinations, although separate reporting of the destinations of disadvantaged students will not begin until 2018.
Suppression of small numbers – to ensure that data remains anonymised – is bound to compromise severely the impact of this exercise, but the aspiration is worthy even if the implementation fails to match it.
Historically the POLAR-fixated higher education sector has typically disregarded the destinations data, though it really ought to pay a little more attention.
The repatriation of higher education policy to DfE will make some difference, for BIS spearheaded the HE sector’s ‘not invented here’ response.
A point not lost on the UUK’s Social Mobility Advisory Group, which rightly advocates the development of a variegated basket of measures – including measures of household disadvantage – to strengthen cross-sectoral collaboration.
The publication of experimental FSM performance indicators for widening participation (UKPIs) should also help to concentrate minds. But those promised for July 2016 did not materialise – and there is as yet no target date for their eventual appearance.
To give them credit, OFFA did at least acknowledge the publication of this data, though in one of their more anodyne press releases.
Sir Les observed:
‘We are continuing to see good progress towards achieving fair access to higher education. However, I am concerned that these figures show the proportion of disadvantaged students progressing to higher education remaining stubbornly lower than for other students. These statistics are particularly challenging for those universities with the highest entry requirements, where the gap is even wider.’
But is this really accurate?
What more sophisticated messages can we draw from the data?
What changes, if any, are evident since my equivalent post last year?
And what exactly was achieved during this quinquennium?
.
Nature of the dataset
The new publication is the eighth in the series and the first not to carry an ‘experimental’ tag.
The first dataset, for 2010/11, appeared in July 2012. For the first time the 2013/14 data was published initially in provisional form, in October 2015, followed by a final version in January 2016.
The same pattern will be observed this time round. The revised edition will be published here alongside the performance tables, provisionally on 19 January 2017. The revised version will also include mainstream independent schools, excluded from this analysis.
The new release relates to the destinations of students who completed KS5 in AY2013/14 and who entered higher education in AY2014/15.
It includes students aged 16, 17 or 18 entered for at least one A level or equivalent level 3 qualification. They must record ‘sustained participation’ in higher education throughout the first two terms of the academic year, so from October 2014 to March 2015.
Three measures of HE selectivity are used:
- The top-third. This is the ‘higher tariff’ measure routinely adopted by HEFCE, UCAS, OFFA and the former BIS. It includes the top third of institutions, as ranked by mean UCAS tariff score based on students’ best three A level grades. It counts in students aged 17 and studying A levels at schools and colleges in England who progress to UK higher education institutions by age 19. There is some annual churn amongst the institutions included in the measure, though 82% were unchanged from 2006/07 to 2013/14 (it was 88% unchanged up to 2012/13, so the churn may be increasing). This is an overly broad measure that includes institutions with mean points values between 260 and 400. It hides a multitude of sins.
- All UK Russell Group universities. The Russell Group is of course a membership club and a very crude proxy. It is a byword for selective higher education but several other institutions outperform members on one or more measures, including the one described above.
- Oxford and Cambridge (Oxbridge). Another byword, for highly selective education, but broadly meaningful at institutional level.
These three measures are nested, in that Oxford and Cambridge are members of the Russell Group and all the Russell Group members are higher tariff institutions.
There are now two measures of disadvantage:
- Students eligible for and receiving free school meals at any point during Year 11 (FSM).
- Students eligible for pupil premium during Year 11.
The students in the 2014/15 dataset would likely have been in Year 11 in AY2011/12.
Pupil premium was first introduced in 2011 for FSM and looked after children. But in April 2012 the deprivation criterion was extended to all those eligible for and receiving FSM at any point in the last six years (Ever6 FSM).
This should mean that these two measures are also nested, in that every FSM student in Year 11 ought also to be a pupil premium student.
In financial year 2012-13 26.7% of secondary pupils were eligible for the deprivation element of the pupil premium, compared with 16% of secondary pupils eligible for and receiving FSM in January 2012.
We must also add a relatively small number of looked after children, but no separate figure is provided for the secondary sector, so I have used the 26.7% figure as a proxy for the overall incidence of pupil premium below.
I have also made the assumption that, given a pupil premium rate approximately two-thirds higher than the FSM rate, one might expect to see approximately two-thirds (67%) more pupil premium students than FSM students attending selective universities.
Numbers are rounded to the nearest five, so totals do not always agree and small improvements in small numbers are somewhat inexact. An ‘x’ denotes either one or two students.
.
Headline measure: Percentage FSM to higher tariff and Russell Group institutions
Government statistical publications are typically coy about bad news, but last year’s destinations SFR was refreshingly different:
‘The gap between the percentage of free school meals eligible students going to the top third higher education institutions and all other students has widened from 7 to 9 percentage points between 2010/11 and 2013/14.
For Russell Group institutions the gap has widened from 6 to 7 percentage points.’
This was accompanied by a graph illustrating the trend, which is not reproduced in the new edition. This confines itself to supplying the 2014/15 percentages for disadvantaged (pupil premium) and other students, so ignoring the FSM measure entirely.
Chart 1, below, reproduces the graph with the addition of the provisional 2014/15 data.
It shows that, in 2014/15, the FSM gap for higher tariff institutions remained unchanged at nine percentage points, while the FSM gap for Russell Group institutions also stayed at seven percentage points.
There has been no change since 2013/14, so the statement above remains true – both gaps have widened between 2010/11 and 2014/15.
.

Chart 1: Higher tariff and Russell Group HE destinations by FSM eligibility, percentages 2010/11 to 2014/15 (provisional)
.
FSM numbers entering selective HE since 2010/11
The headline percentages are of limited value, so I make it a point of principle to dig out the actual student numbers in the underlying data. These are shown in Chart 2.
One immediately obvious piece of good news is that the number of FSM students attending Oxbridge has risen from 50 to 65, after three years stalled on 50.
The rounding renders these figures imprecise but, if we take them at face value, this represents a substantial 30 percentage point improvement.
In fact the data shows that the schools sector supplied 60 students (rounded to the nearest five) and the FE sector supplied a further 10 (also rounded), but when the total is rounded it comes to 65 rather than 70.
.
.

Chart 2: Oxbridge, Russell Group and higher tariff destinations by FSM eligibility, student numbers 2010/11 to 2014/15 (provisional) (numbers rounded to nearest 5)
.
If we take 2010/11 as the baseline, this means that Oxbridge FSM numbers have increased by 117%, almost identical to the increase of 118% for all Russell Group institutions and significantly ahead of the 75% increase at higher tariff institutions.
On the other hand, if 2011/12 is selected as the baseline, Oxbridge registers a 30% improvement, but the Russell Group has an improvement rate of 60%, twice as strong, while higher tariff institutions are a little ahead at 65%…
So beware of misleading claims based on this data.
The abiding point is that the graph now shows all numbers moving in the right direction.
But this improvement may be attributable to overall increases in the number of students admitted, so Chart 3 shows the percentage of all entrants represented by FSM students.
.

Chart 3: Oxbridge, Russell Group and higher tariff destinations: Percentage of students from FSM backgrounds, 2010/11 to 2014/15 (provisional)
.
According to this measure:
- Oxbridge has doubled the rate of FSM students admitted since 2010/11, although the improvement since 2011/12 is a much more modest 24 percentage points.
- Russell Group institutions have improved by 50 percentage points since 2010/11, only half the rate recorded by Oxbridge. But their improvement since 2011/12 is 37 percentage points, significantly stronger than Oxbridge.
- Higher tariff institutions have registered a somewhat more modest 33 percentage point improvement since 2010/11 and a 36 point improvement since 2011/12.
- Over the entire period the gap between Oxbridge and the Russell Group has grown slightly, from 1.9 percentage points in 2010/11 to 2.2 percentage points in 2014/15, while the gap between Oxbridge and higher tariff institutions has also increased marginally, from 3.0 percentage points to 3.1 percentage points.
Overall the lines are all pointing in the right direction, despite a period in the doldrums for Oxbridge, but Oxbridge continues to lag significantly behind the Russell Group as a whole – and there is a smaller yet still significant gap between the Russell Group and all higher tariff institutions.
.
Disadvantaged students entering selective higher education in 2014/15
As noted above, a new measure of disadvantage based on receipt of pupil premium – ‘ever 6’ FSM and looked after children – has been introduced for the first time in 2014/15.
Indeed the main text of the SFR refers to it in preference to the FSM measure:
‘A higher education destination was the most common choice for disadvantaged students (44%) but they were less likely to progress to sustained higher education than other students completing key stage 5 study (49%).
This disparity was greater for more selective higher education institutions. Around 90 disadvantaged students had a sustained destination at Oxford or Cambridge universities in 2014/15.’
So, whereas some 65 FSM students progressed to Oxbridge, 90 pupil premium students did so, almost 40% more, leaving aside the impact of rounding.
The next chart compares FSM and pupil premium numbers for the different measures of higher education selectivity. It shows that the Russell Group took in 63% more pupil premium than FSM students while higher tariff institutions admitted some 61% more.
These differences are broadly in line with the variance between FSM (16%) and pupil premium (26.7%) rates when the bulk of these students were in Year 11. But Oxbridge appears to be under-recruiting.
.
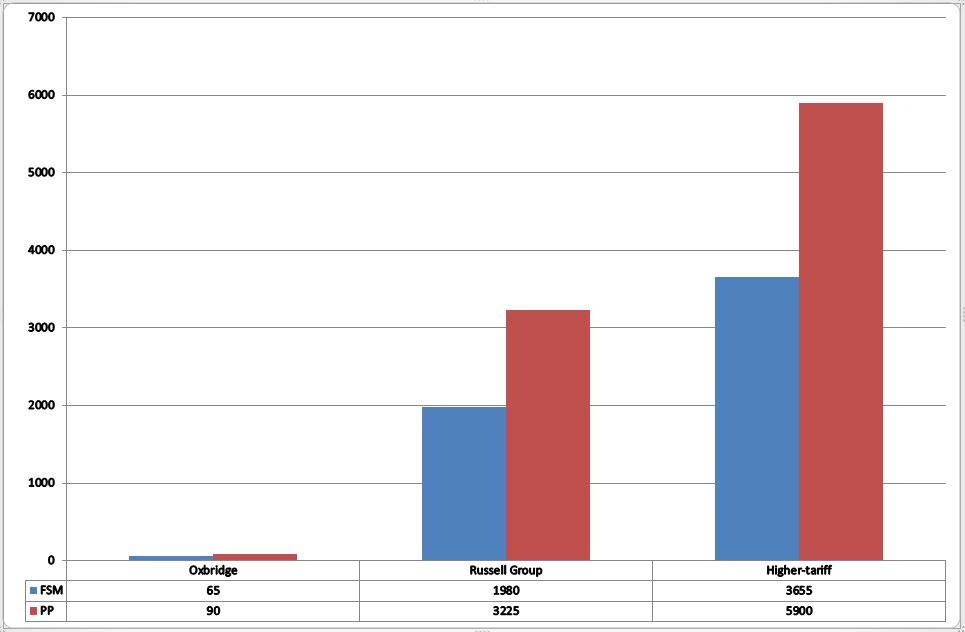
Chart 4: Oxbridge, Russell Group and higher tariff universities, number of FSM and pupil premium students in 2014/15 (provisional)
.
The percentages of all entrants represented by pupil premium students, relative to the comparable FSM percentages, should provide a more reliable guide.
Some 3.6% of students at Oxbridge received pupil premium in Year 11, compared with 2.6% of FSM students, about 38% more.
But the pupil premium figure for all Russell Group institutions is 7.8%, almost 63% higher than the FSM rate. And at higher tariff institutions the pupil premium rate is about 61% higher. So the case for under-recruitment of pupil premium students at Oxbridge is strengthened.
And Oxbridge is noticeably further behind the whole Russell Group on pupil premium recruitment than it is on FSM recruitment. To match its performance on FSM relative to the whole Russell Group it would need to increase its pupil premium percentage to 4.2% or thereabouts, increasing pupil premium numbers to around 105 students.
If Oxbridge had recruited the same percentage of pupil premium students as all Russell Group institutions it would have taken in some 195, more than double the number it actually recorded.
.

Chart 5: Oxbridge, Russell Group and higher tariff universities, percentage of students from FSM and pupil premium backgrounds, 2014/15 (provisional)
.
Disadvantaged students entering selective HE by school/college admissions policy
Another new dimension to the 2014/15 data is a breakdown of destinations according to the admissions policy of the exporting school or college.
The SFR provides a graph showing the percentages of disadvantaged and all other students progressing from six variants – comprehensive, selective, modern and other schools, FE and sixth form colleges – to all HE, higher-tariff and Russell Group institutions.
The version below shows that selective schools are more successful than both comprehensive schools and sixth form colleges at sending disadvantaged students to Russell Group, higher-tariff and all higher education institutions.
However:
- At selective schools there is a larger 10 percentage point gap between the proportion of pupil premium students (29%) and other students (39%) progressing to Russell Group institutions. At comprehensive schools and sixth form colleges this gap is only six percentage points (9% versus 15% at comprehensives; 8% versus 14% at sixth form colleges).
- There is an eight percentage point gap between the proportion of pupil premium and other students progressing to higher tariff institutions at selective schools, comprehensive schools and sixth form colleges alike.
This might suggest that grammar schools are not quite as successful as they should be at sending pupil premium students to Russell Group universities.
.
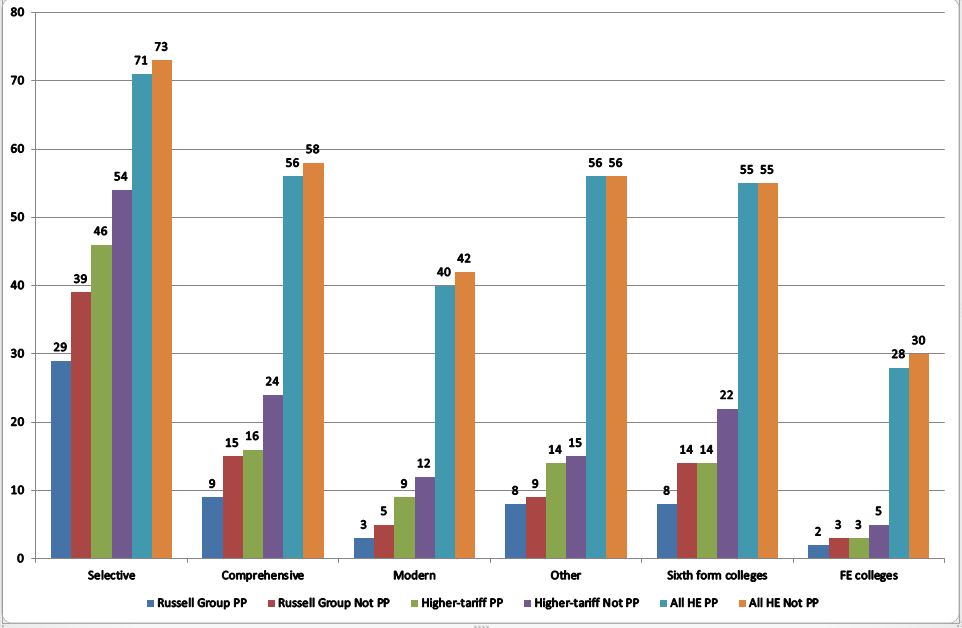
Chart 6: Russell Group, higher tariff and all HE destinations, percentage of pupil premium and other students by institutional admission policy, 2014/15 (provisional)
.
Percentages progressing to Oxbridge are too small to feature on the chart. Even at selective schools, only 2.3% of the pupil premium cohort is destined for Oxbridge. At comprehensives this falls to below 0.3%.
The three pie charts below shows how the pupil premium populations arriving at Oxbridge, all Russell Group and all higher tariff institutions respectively are distributed according to the admissions policy of their school or college.
The first, for Oxbridge, shows that the majority of the pupil premium population (61%) is drawn from comprehensive schools, with selective schools supplying a further 28%. Since there are only 163 grammar schools, the selective sector is disproportionately successful.
Only a handful of Oxbridge’s pupil premium students are drawn from sixth form colleges and FE colleges, plus the odd one or two from other institutions. None attended modern schools.
Nineteen grammar schools (12%) apparently sent no pupil premium students to Oxbridge. For all other schools the numbers are suppressed.
.

Chart 7: Numbers of pupil premium students destined for Oxbridge drawn from schools/colleges by admissions policy, 2014/15 (provisional).
.
The pattern is noticeably different for all Russell Group institutions. Chart 8 indicates that some 54% of pupil premium students arriving at Russell Group institutions are drawn from comprehensive schools, compared with almost 24% from sixth form colleges, around 11% from FE colleges and just below 10% from selective schools.
Grammar schools are still disproportionately successful but they have much more competition.
.
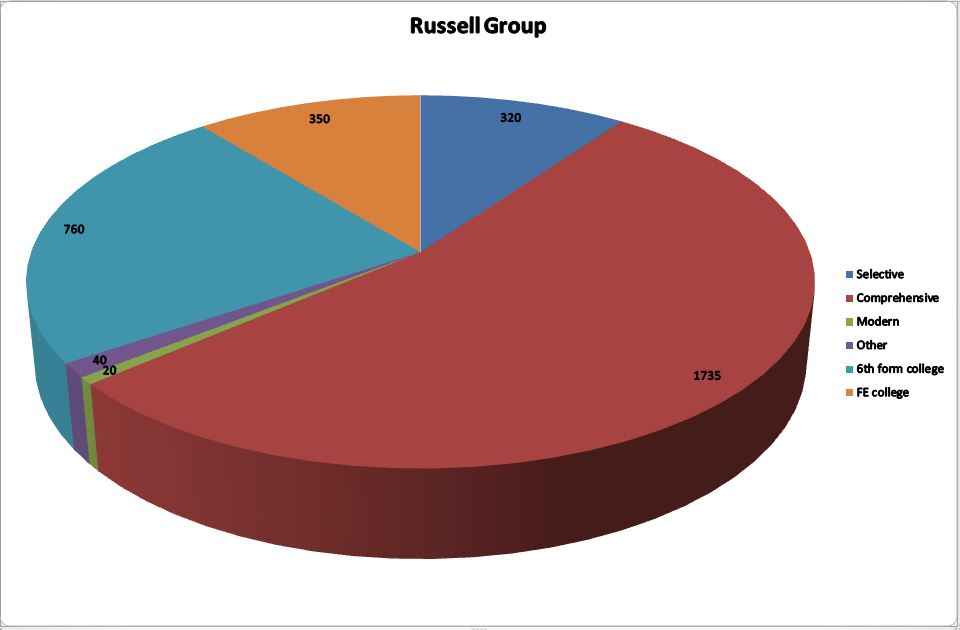
Chart 8: Numbers of pupil premium students destined for Russell Group universities drawn from schools/colleges by admissions policy, 2014/15 (provisional).
.
The underlying institutional data shows that there were 51 schools and colleges from which ten or more pupil premium students progressed to Russell Group institutions.
The most successful in this respect were Loreto College, Manchester (60), Woodhouse College Barnet (40), City and Islington College (28), the London Academy of Excellence, Newham (27), Solihull Sixth Form College (24), Cambridge Heath Sixth Form Centre, Tower Hamlets (20) and Seven Kings School Redbridge (20).
Only three selective schools met this criterion: Handsworth Grammar School, Birmingham, Townley Grammar School in Bexley and Latymer School in Enfield.
The final chart, for higher tariff institutions reveals a similar pattern to that for Russell Group institutions. Some 54% of pupil premium students are drawn from comprehensive schools, 22% from sixth form colleges, 13% from FE colleges and less than 9% from selective schools.
.

Chart 9: Numbers of pupil premium students destined for higher tariff institutions drawn from schools/colleges by admissions policy, 2014/15 (provisional).
.
The institutional data reveals 44 schools and colleges from which twenty or more pupil premium students progressed to higher tariff institutions. The most successful were: Loreto College (77), City and Islington College (71), Woodhouse College (67), Joseph Chamberlain Sixth Form College Birmingham (62), Christ the King Sixth Form College Lewisham (52) and Leyton Sixth Form College Waltham Forest (50).
There were no selective schools in this sample.
.
Summary of main findings
This analysis of the provisional 2014/15 destinations data reveals that:
- The seven percentage point gap between the percentage of FSM students and the percentage of all other students admitted to Russell Group institutions is unchanged from 2013/14. This gap has widened slightly since 2010/11.
- The nine percentage point gap between the percentage of FSM students and the percentage of all other students admitted to higher tariff institutions is also unchanged from 2013/14. Both rates improved by one percentage point. This gap has also widened somewhat since 2010/11.
- But Oxbridge now bucks this trend. After a period of stagnation Oxbridge improved the proportion of FSM students admitted by approximately 30% in 2014/15.
- Taking 2010/11 as the baseline, the improvement in FSM admissions at Oxbridge is now broadly in line with the improvement at all Russell Group institutions. But taking 2011/12 as the baseline, the improvement rate for all Russell Group institutions is still significantly stronger.
- Since 2010/11, the FSM share of all admissions to Oxbridge has doubled – although admittedly from a very low base – while all Russell Group institutions have managed only a 50% improvement. The selection of a different baseline has a profound effect on these relationships however.
- The percentage point gap for FSM admissions between Oxbridge and all Russell Group institutions has widened slightly since 2010/11, from 1.9 points to 2.2 points. However in 2014/15 it fell from the 2.5 points registered in 2013/14.
- Some 90 pupil premium students went to Oxbridge in 2014/15, the first year in which this data has been collected. Comparison between FSM and pupil premium rates in 2011/12, when most of these students were in Year 11, suggests that Oxbridge’s pupil premium admissions are lower than they should be relative to FSM.
- By comparison the relationship between pupil premium and FSM students admitted to all Russell Group and higher tariff institutions is broadly as it should be given the respective pupil premium and FSM rates in 2011/12.
- If Oxbridge had matched its FSM performance with pupil premium students it would have recruited about 17% more. Had it managed to match the pupil premium recruitment rate of all Russell Group institutions it would have more than doubled the number admitted, from 90 to 195.
- There is a noticeably larger gap between the percentage of pupil premium and all other students progressing to Russell Group universities from selective schools (10 percentage points) than there is at comprehensives and sixth form colleges (six percentage points). The gap is exactly the same when it comes to progression to all higher tariff institutions. Grammar schools in particular need to ensure that they have equal expectations of disadvantaged high attainers.
- Over 60% of the pupil premium students entering Oxbridge came from comprehensive schools. Some 28% came from the 163 selective schools demonstrating their disproportionate strength in this respect.
- But, when it comes to admission to all Russell Group and higher tariff institutions, more pupil premium students are drawn from both sixth form colleges and FE colleges than come from selective schools. Selective schools still perform creditably, supplying 9-10% of all pupil premium students.
- 51 schools and colleges sent ten or more pupil premium students to Russell Group universities and 44 sent 20 or more pupil premium students to all higher tariff institutions. Sixth form colleges, many of them in London, were particularly strongly represented.
- Only three grammar schools were in the first group and there were none in the second. There is much work to do if existing grammar schools are to be converted into engines of social mobility.
- In 2014/15 the London Academy of Excellence sent no more than three pupil premium students to Oxbridge (the exact numbers are suppressed). More selective 16-19 institutions will enter the fray in 2015/16.
Overall, there is reason to be cautiously positive about the trends in recruitment of disadvantaged students to Russell Group and higher tariff institutions, but progress is steady rather than spectacular.
Oxbridge must sustain the welcome improvement in FSM admissions secured in 2014/15 and strengthen pupil premium admissions significantly.
.
Policy implications
The question arises whether steady progress is sufficient, or whether we ought to be more ambitious.
Key features of the existing policy landscape include:
- Maintenance of the existing access agreement methodology within the Office for Students. The government claims that this is extremely successful while also insisting that selective institutions need to up their game. But it refused to implement proposals to give the Director for Fair Access power to impose targets on consistently unsuccessful institutions, accepting universities’ argument that this would compromise their autonomy. OFFA claims to have negotiated improvements to 47.5% of 2017/18 access agreement targets, but this process is not transparent. The revelation that OFFA successfully persuaded Cambridge to improve its 2017/18 POLAR quintile 1 target was exceptional.
- A package of second order administrative reforms advanced by the government and by the UUK social mobility advisory group it commissioned. These are designed to strengthen practice through additional (though limited) transparency requirements, data-sharing, monitoring (via TEF benchmarks), evaluation of outreach and sharing of evidence. Two generic system-wide targets (ambitions?) also remain in force, but nothing focused explicitly on selective institutions.
- Proposals in the schools green paper to expand selection and increase the proportion of disadvantaged students in existing selective schools (while also increasing university sponsorship of state-funded schools). The impact will be localised and confined largely to existing grammar schools. The government has already conceded that it is not contemplating wholesale selection and political opposition will act as a brake on expansion. In any case the impact on HE destinations will take several years to work through. It is not yet clear whether a commitment in the preceding white paper – to ‘investigate, fund and evaluate approaches to help the brightest students in state schools to fulfil their potential’ – will be honoured.
Despite the reformist intentions behind the schools green paper this combination will never deliver anything better than steady incremental improvement. It remains vulnerable to uncooperative heel-dragging by HE institutions. It is also costly and inefficient: each pound expended delivers very little progress.
Three further reforms would add the requisite rocket boosters. I’ve advanced each of these before, but they would work even more powerfully in combination:
- Establish through consultation a basket of deprivation measures as recommended by the social mobility advisory group, a ‘balanced scorecard’ combining individual/household, school/college and postcode indicators. Require all HE institutions to include this amongst their access agreement targets, alongside additional targets for participation by more specific populations under-represented at that institution.
- Introduce a national system of access thresholds – reflecting the minimum academic standard and subject knowledge necessary to successfully complete a course – so following the model that the Scottish government is committed to introducing for all Scottish degree programmes by 2019. Promote voluntary adoption of such thresholds but also require their introduction in all remaining institutions outside Scotland that fall each year within the bottom third of the distribution of achievement against the balanced scorecard.
- Select eligible disadvantaged high attainers in English state-funded schools and colleges into a national 11-19 support scheme rather than a school, with open access during KS3 to soften the cliff-edge and accommodate later developers. Funding would be drawn from an annual national pupil premium topslice plus commensurate contributions from the post-16 sector and the access budgets of participating HE institutions. This would bring greater coherence to the supply side – where a bewildering array of HEI, third sector and commercial providers run a plethora of small-scale programmes of variable quality, each with its own target group and entry requirements. It would place on schools and colleges responsibility for managing personal budgets on behalf of participating students, purchasing a tailored sequence of activities to complement their in-house support. Participating universities would guarantee places to students who successfully completed their programme. The scheme could be designated as a virtual school, incorporating a platform for delivery of online components.
.
TD
October 2016


Leave a comment