.
This post examines ministerial targets for improving England’s educational performance by 2020, as measured by international comparisons studies.
It explores the evolution of these targets, how they might be interpreted and the prospects for achieving them given likely outcomes from the next round of reports, scheduled for publication in December 2016/2017.
- PISA 2015 results (maths, reading and science at age 15) will be published in December 2016, some seven months hence. PISA is a triennial survey so there will be one further set of results in December 2019 before the deadline for achievement of the target.
- TIMSS 2015 outcomes (maths and science at ages 9/10 and 13/14) will also be published in December 2016. TIMSS is conducted every four years, so the results of TIMSS 2019 should be available by December 2020, just as the deadline expires.
- PIRLS 2016 results (reading aged 9/10) will not be published until December 2017. The following round will not be completed before the expiry of the deadline for achievement of the targets.
Many have strong reservations about the methodology and relevance of such studies, but ministers have made it clear that they will rely on them to monitor the impact of their educational reforms, not least because those reforms radically alter domestic assessment and accountability measures.
The December 2016 results will provide the first real opportunity to assess the impact of the panoply of education reforms embarked upon by the previous Coalition Government. They will also show just how (un)likely successor Conservative ministers are to achieve their 2020 targets.
It is of course customary for ministers to claim responsibility for good results from such studies, while simultaneously arguing that poor results are attributable to the performance of a weaker predecessor government and/or that the impact of its own reforms has not yet worked through.
PISA has by far the higher profile, but England’s performance is comparatively better in TIMSS/PIRLS than in PISA. We can expect big headlines towards the end of this year, as well as concerted efforts to spin the results.
But the present level of interest is negligible. Back in February 2016 I tweeted:
.
.
No-one was prepared to play ball.
.
The targets framed
Back in February 2015 Secretary of State Morgan launched the educational arm of the Tory General Election campaign by declaring ‘war on illiteracy and numeracy’.
Her paywalled article in the Sunday Times set an ambitious target which it and other media outlets reported as:
‘…for England’s schools to be the best in Europe for English and maths by 2020, and among the top five countries in the world’.
The Daily Mail helpfully illustrated the scale of her ambition, showing what improvement would be needed in England’s mean PISA 2012 maths score.
It would have to improve by 59 points, from 495 to 554 points, to emulate the performance of South Korea, standing in 5th place in the rankings behind Shanghai, Singapore, Hong Kong and Taiwan respectively.
It could of course expect these leading countries to be taking steps to improve their own performance, so England would have to progress at a faster rate than Korea, while also hoping that it would not be overtaken by any competing jurisdictions.
This initial clarity became rather garbled in Prime Minister Cameron’s speech the following day. He informed us that one of his educational ambitions was:
‘…Making Britain the best country at maths, science and computing.’
So English dropped out of the equation, to be replaced by computing, the target became an ambition, but the ambition was to become best in the world bar none.
The Conservative Manifesto followed Cameron’s lead, but replaced computing with engineering:
‘We aim to make Britain the best place in the world to study maths, science and engineering, measured by improved performance in the PISA league tables.’ (p.34)
Never mind that PISA does not measure engineering performance – the link with PISA is made explicit, at least for maths and science. But no timescale is attached.
.
The targets revived
Morgan has returned to this theme more recently, though selectively.
In September 2015 she gave a speech about improving child literacy. The explicit commitment to match the ‘top five in the world’ had gone by the wayside, probably because statisticians had demonstrated that – in terms of PISA at least – it would be almost impossible to achieve.
Morgan speaks in terms of making ‘this country the best in Europe if not the world’.
In relation to reading she says:
‘So we’ve set ourselves an ambitious challenge over the next 5 years: to make children in this country become the most proficient in Europe.
It’s a bold ambition.
Although international surveys show that children in this country are relatively good in reading, our 9- and 10-year-olds are still ranked sixth in Europe, putting us behind places like Northern Ireland and Finland.
And of course, even if we run to catch up, those other countries won’t stand still.
So we don’t just need to match them; we need to overtake them.
Now that won’t be easy.
But that international study of 9- and 10-year-olds – The Progress in International Reading Literacy Study – reveals something very interesting.
The best readers in this country are already the best readers in Europe – beating even the top performers in Finland, number 1 in the rankings.
What’s holding us back is a long tail of underachievement, which leaves far too many young people behind, in particular the most disadvantaged.’
Note that the target is now apparently focused exclusively on reading – and the measure is PIRLS rather than PISA. The accuracy of these statements is reviewed below.
In a November 2015 speech at the CBI Annual Conference Morgan recalls:
‘We committed, before the election, to make England the best place in the world to learn maths, science and engineering and for our children to be the best readers in Europe by 2020.’
Here she is guilty of some judicious and injudicious manipulation:
- on one hand she has translated an aim into a firm commitment, followed the ‘best in the world’ line on maths, science and engineering (not computing) and added in a 2020 deadline;
- on the other hand, she has conveniently forgotten the ‘top five in the world’ element of her own commitment on English and narrowed her ‘best in Europe’ target to reading, omitting maths as well as writing.
You will have noted that the next round of PIRLS reading results is not due until 2021.
More recently, when Morgan appeared before the Education Select Committee in April 2016, she appeared to change the target again, by introducing writing into the equation:
‘We said we want to be top in Europe for reading, writing, and maths.’ (Q86, p.5)
One can search in vain for any reference to these targets – or indeed any comparable targets – in the white paper ‘Educational Excellence Everywhere’ (March 2016), although that publication uses the term ‘world-leading’ 16 times.
The DfE strategy published alongside the white paper is subtitled ‘world-class education and care’ but there is not a whiff of targetry about it. The same applies to DfE’s Single Departmental Plan: 2015 to 2020 (February 2016).
Why is this?
Because the Government is only too aware that, when targets are inserted in official documents, failure to achieve them is more glaring and becomes a stick with which to beat the incumbent minister.
If targets are only ever expressed by the minister responsible for achieving them they can more easily be set aside when that minister has moved on – as he or she is almost bound to have done before judgement day.
.
The targets interpreted
Given these shifting sands, what should we be preparing to monitor as we anticipate publication of the PISA and TIMSS results in seven months’ time?
For Secretary of State Morgan the PISA reading data is paramount, because PIRLS results are not due until 2017. PISA and TIMSS maths results are also critical because of her wider ‘war on illiteracy and innumeracy. The full set of maths and science outcomes are relevant to that manifesto commitment, but especially the PISA results because they are mentioned explicitly.
In each case we should ascertain the improvement necessary to match the best European performer, while also considering what it would take to become 5th best in the world. Sometimes there is a large gap between these two benchmarks; in a few cases the European benchmark is equally or more demanding.
We should estimate the progress necessary by 2016/17 to demonstrate a realistic prospect of achieving ministers’ 2020 targets.
Our attention should be focused significantly on that long tail of underachievement, but not exclusively so. The mean scores reveal aggregate progress across the attainment spectrum, while achievement at the top end is equally significant, for the OECD and for domestic education policy.
The sections below deal with mean scores, low and high achievement benchmarks respectively. Each section deals with the full range of PISA, TIMSS and PIRLS outcomes, other than PISA problem-solving.
.
The targets analysed
.
Mean scores
England’s PISA 2012 National Report gives the following outcomes:
.
| England | Best in Europe | 5th best in world | |
| Reading | 500 | 524
(Finland) |
536
(South Korea) |
| Maths | 495 | 535
(Liechtenstein) |
554
(South Korea) |
| Science | 516 | 545
(Finland) |
545
(Finland) |
.
Even if we assume that 2012 performance is frozen – there is no upward trajectory and no change in rank order – England needs to improve its mean score by 24 points in reading and 40 points in maths to become the best in Europe. To become 5th best in the world it needs to improve by 36 and 59 points respectively. In science a 29-point improvement is needed on both counts.
Since 40 PISA points are regarded as the equivalent of a year’s progress, this translates to a full year’s improvement in maths, 9 months’ improvement in science and 7 months’ improvement in reading, simply to match the best in Europe.
The chart below plots the improvements required to achieve this outcome, assuming that other countries’ PISA 2012 performance is frozen, while also showing the progress made since PISA 2006.
Even on these highly unlikely assumptions, the rate of improvement required is exceedingly ambitious.
The chart suggests that, to be on track to achieve the target, England would need to achieve mean PISA 2015 scores of around 508 in both maths and reading and around 526 in science. That means an improvement since 2012 of eight points in reading, ten points in science and 13 points in maths.
.
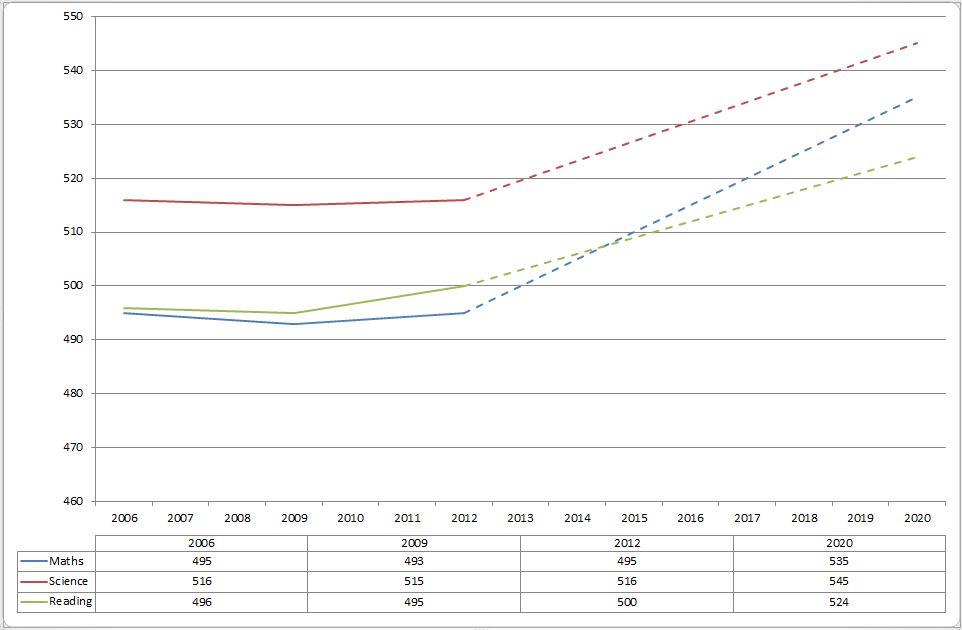
Chart 1: Improvements required to become ‘best in Europe’ on PISA by 2020, assuming other countries’ 2012 outcomes unchanged
.
Mean scores for TIMSS and PIRLS can be found in the national report on the TIMSS 2011 outcomes and the parallel report on PIRLS:
.
| England | Best in Europe | 5th best in world | |
| Maths (9-10) | 542 | 562
(Northern Ireland) |
585
(Japan) |
| Maths (13-14) | 507 | 539
(Russia) |
570
(Japan) |
| Science (9-10) | 529 | 552
(Russia) |
552
(Russia and Taiwan) |
| Science (13-14) | 533 | 552
(Finland) |
558
(Japan) |
| Reading (9-10) | 552 | 568
(Russia and Finland) |
558
(Northern Ireland) |
.
England is indeed ranked sixth in Europe, as Morgan stated, behind Russia, Finland, Northern Ireland, Denmark and Croatia and equal with the Republic of Ireland. The national report says that only Russia and Finland are judged to be scoring significantly higher than England.
Making the same assumptions as those above, improvements of between 18 and 32 points are needed to match the best in Europe. To reach 5th best in the world, improvements of between 6 and 63 points are required. The biggest gaps are in maths, then science, then reading.
The chart below shows the recent trends in England’s TIMSS and PIRLS performance since 2003 (actually since 2001 for PIRLS) and projects the improvement necessary to become ‘best in Europe’ by 2020, on the same ‘frozen’ assumptions.
.
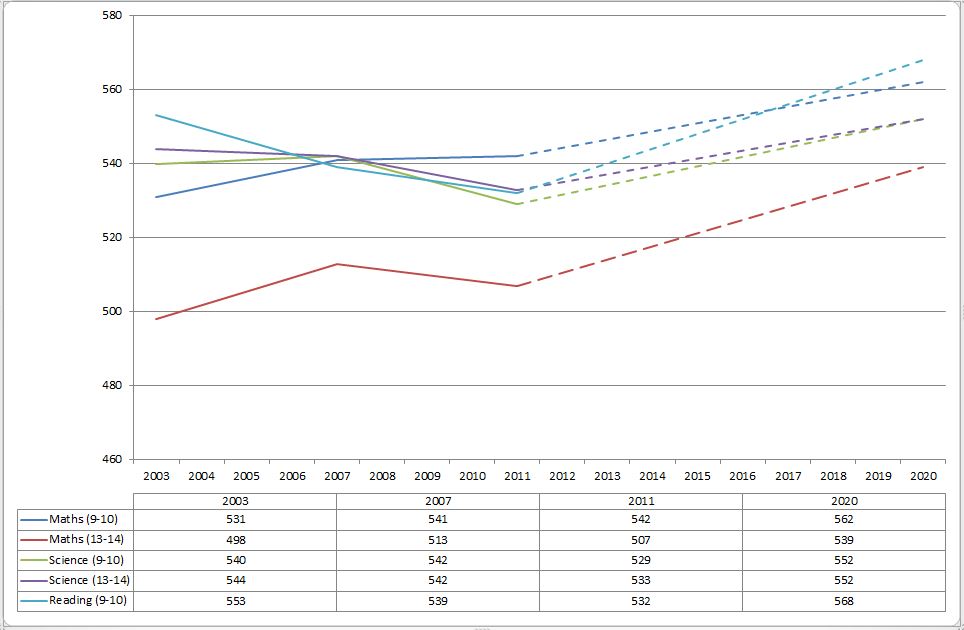
Chart 2: Improvements required to become ‘best in Europe’ on TIMSS/PIRLS by 2020, assuming other countries’ 2011 outcomes unchanged
.
It is noteworthy that, especially since 2007, the trend in England’s results has been downwards, with only maths for 9-10 year-olds remaining stable. Set against this the projected improvements look ambitious, even when spread across two assessment cycles.
To be on trajectory for such improvements, mean scores in 2016/17 need to be over 520 for maths aged 13-14, over 540 for the two science assessments and over 550 for maths aged 9-10 and reading.
.
Low achievement
Morgan has highlighted the ‘long tail of underachievement’, most notably in her speech on child literacy.
More recently the benchmark for this target group has been described in terms of ‘functional literacy and numeracy’.
‘Educational Excellence Everywhere’ draws attention to the former:
‘Poor children still have worse educational outcomes at every stage and we have a long tail of low attainment – 17% of UK students fail to reach “modern functional literacy”, compared to just 11% in Canada.’
The same statistic is included in the DfE’s Strategy document.
In ‘Universal Basic Skills: What Countries Stand to Gain’ (Hanushek and Woessmann for OECD, 2015) the authors define basic skills as achieving the borderline between level 1 and level 2 on the PISA scale (420 points). In the case of reading they label this ‘modern functional literacy’. They apply the same benchmark in maths and science
Elsewhere, the White Paper also uses the PISA level 2/3 borderline as an indicator of low attainment:
‘Compared to other advanced economies, England has a long tail of low achievement: in 2012, 22% of our 15-year-old students failed to reach the benchmark level 2 in the PISA mathematics assessment, a larger share than in Canada (14%), Poland (14%), the Netherlands (15%) or Germany (18%).’
This analysis adopts the functional basic skills benchmark.
England’s PISA 2012 National Report shows that the percentages of young people below PISA level 2 in each assessment were as follows:
.
| England | Best in Europe | 5th best in world | |
| Reading | 16.7 | 9.2
(Estonia) |
9.4
(Vietnam) |
| Maths | 21.7 | 10.6
(Estonia) |
10.6
(Estonia) |
| Science | 14.9 | 5.0
(Estonia) |
6.7
(S Korea and Vietnam 4=) |
.
Of course, in this case, the lower the percentage the better a jurisdiction is performing.
The chart below shows the trend in performance since PISA 2006 and projects the improvement required to be ‘best in Europe’ by 2020, again on the assumption that other countries maintain their 2012 levels of performance.
.
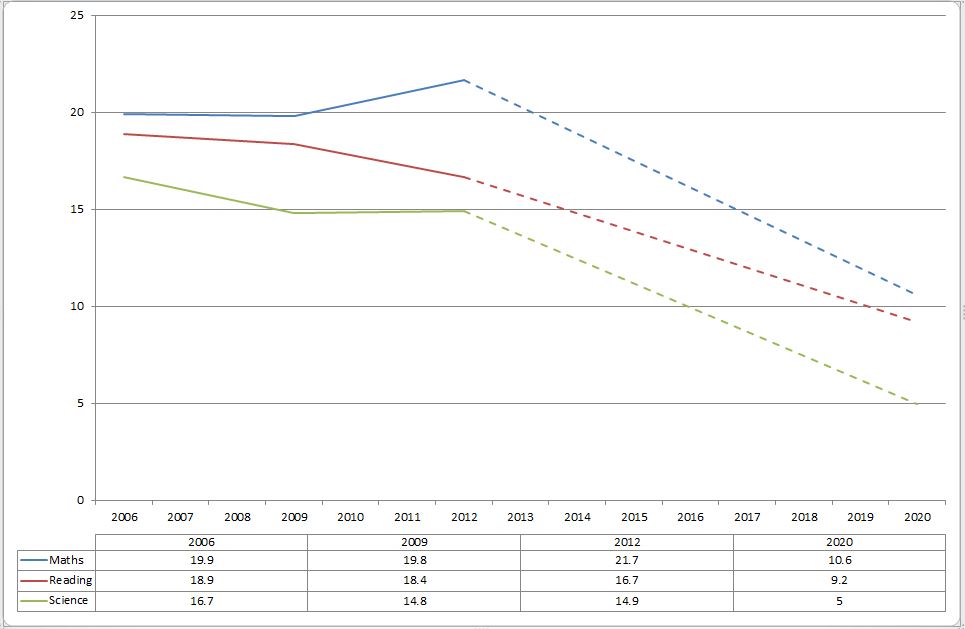
Chart 3: Improvement required to become ‘best in Europe’ for low achievers in PISA by 2020, assuming other countries’ 2012 outcomes unchanged
.
Achieving the desired trajectory in maths and science will be extraordinarily difficult. In reading it will also be challenging. To be in with a chance, the outcomes of PISA 2015 need to be around 16% in maths, 13% in reading and 10% in science.
Turning to TIMSS and PIRLS, the following percentages are for those achieving either the low benchmark (400) or no benchmark at all. To give an indication of the level required, the TIMSS maths (9-10) low benchmark is described in the 2011 national report as:
‘Students have some basic mathematical knowledge. Students can add and subtract whole numbers. They have some recognition of parallel and perpendicular lines, familiar geometric shapes, and coordinate maps. They can read and complete simple bar graphs and tables.’
The equivalent in the PIRLS 2011 national report is:
‘When reading literary texts, pupils can:
- locate and retrieve an explicitly stated detail.
When reading information texts, pupils can:
- locate and reproduce explicitly stated information that is at the beginning of the text.’
.
| England | Best in Europe | 5th best in world | |
| Maths (9-10) | 22 | 11
(Belgium – Flemish) |
7
(Taiwan and Japan) |
| Maths (13-14) | 35 | 27
(Finland) |
13
(Japan) |
| Science (9-10) | 24 | 14
(Russia and the Netherlands) |
14
(Russia and the Netherlands) |
| Science (13-14) | 24 | 12
(Finland) |
15
(Taiwan) |
| Reading (9-10) | 17 | 10
(Croatia and the Netherlands) |
10
(Croatia and the Netherlands) |
.
When it comes to low achievement, England is 13th in Europe in PIRLS 2011 reading, behind countries such as Italy, Portugal and the Czech Republic, but the majority are within only a few percentage points.
Here is the corresponding chart showing historical performance and the improvement required by 2020.
.
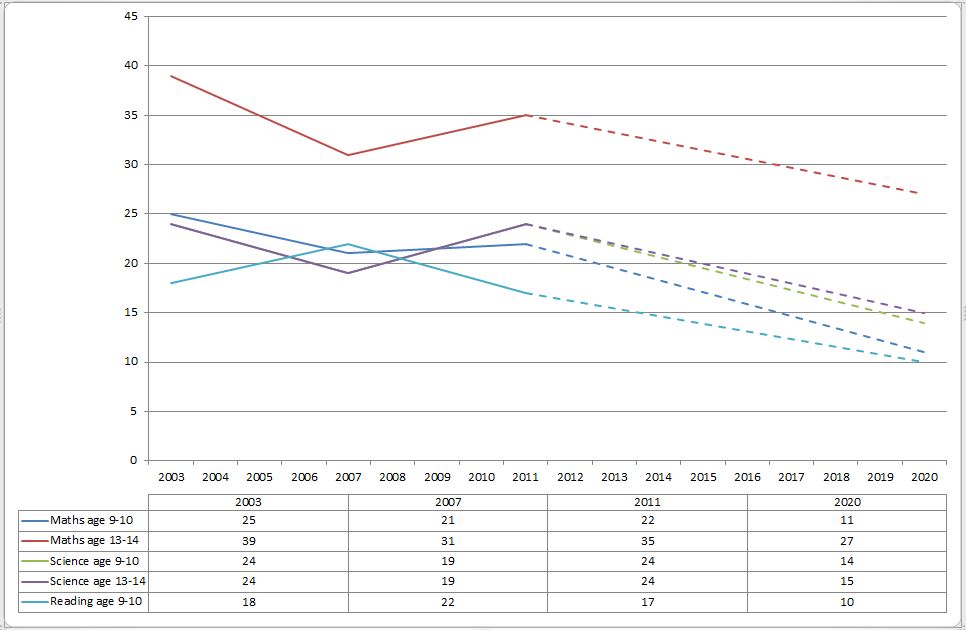
Chart 4: Improvement required to become ‘best in Europe’ for low achievers in TIMSS/PIRLS by 2020, assuming other countries’ 2011 outcomes unchanged
.
It appears that achieving these targets will be comparatively easier via TIMSS/PIRLS than via PISA, but England still needs to return 2016/17 results showing around 30% achieving the low benchmark in maths (aged 13-14), some 15-20% at this level in maths (aged 9-10) and in both science assessments and only 13% in reading.
.
High Achievement
Hanushek and Woessmann draw attention to the economic value of high achievers:
‘It turns out that at both ends of the distribution, a nation’s cognitive skills are significantly related to economic growth, and this is true whether the two extremes are treated individually or jointly. Both the basic-skill and the top-performing dimensions of education performance appear important for growth.
…the process of economic convergence is accelerated in countries with larger shares of high-performing students. Obvious cases are East Asian countries, such as Chinese Taipei, Singapore and Korea, all of which have particularly large shares of high performers, started from relatively low levels, and have shown outstanding growth. The interaction of the top-performing and basic-literacy shares in growth models appears to produce a complementarity between basic skills and top-level skills.’ (p.77)
Moreover, ‘Educational Excellence Everywhere’ highlights the need to focus additional support at the top end of the attainment spectrum as well as the bottom:
‘International comparisons show that while the proportion of high-performing pupils in this country compares well to others at the end of primary school, we remain a long way behind the Far East; and are outstripped by the end of secondary.’
As far as PISA is concerned, there are two potential benchmarks of high achievement: levels 5 and 6 or level 6 alone.
The PISA 2012 National Report supplies the following percentages achieving level 6:
.
| England | Best in Europe | 5th best in world | |
| Reading | 1.3 | 2.3
(France) |
2.3
(France) |
| Maths | 3.1 | 7.4
(Liechtenstein) |
12.1
(South Korea) |
| Science | 1.9 | 3.2
(Finland) |
2.7
(New Zealand) |
.
To achieve ‘best in Europe’, England needs to increase the proportion of its learners achieving the top benchmark by almost 70% in science, 77% in reading and a staggering 140% in maths.
Here is the corresponding chart (level 6 was not introduced in reading until the 2009 cycle). These trajectories appear more realistic but, in order to achieve the targets, PISA 2015 needs to show some 1.8% at level 6 in reading, 2.6% at level 6 in science and over 5% at level 6 in maths.
Given the historical ‘neglect’ identified by the white paper, such progress is unlikely.
.
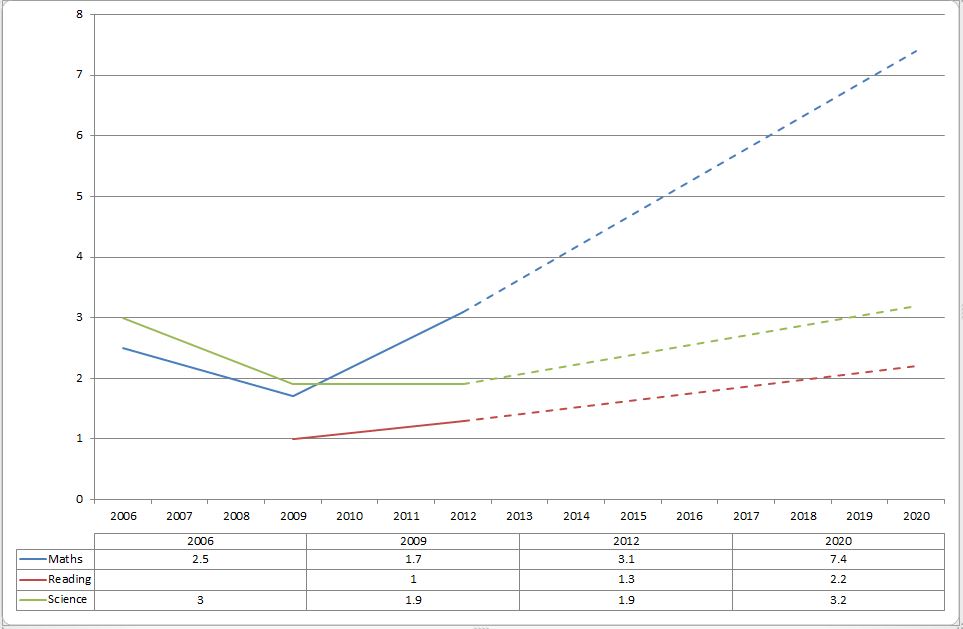
Chart 5: Improvement required to become ‘best in Europe’ for level 6 in PISA by 2020, assuming other countries’ 2012 outcomes unchanged
.
If the PISA high achiever benchmark is levels 5 and 6 combined, the targets change as follows:
.
| England | Best in Europe | 5th best in world | |
| Reading | 9.1 | 13.5
(Finland) |
13.9
(New Zealand) |
| Maths | 12.4 | 24.8
(Liechtenstein) |
30.9
(South Korea) |
| Science | 11.7 | 17.1
(Finland) |
16.7
(Hong Kong) |
.
To achieve ‘best in Europe’ on this measure, England needs to improve the proportion of learners achieving the top two PISA benchmarks by almost 50% in reading and science and by 100% in maths. This is not quite as demanding as the improvement necessary for level 6 only.
Here is the corresponding chart (the entry for 2006 in reading is level 5 only). To stand a realistic chance of achieving the 2020 targets we should expect to see the proportions achieving levels 5 and 6 in PISA 2015 to be around 11% in reading, 14% in science and 17% in maths.
.
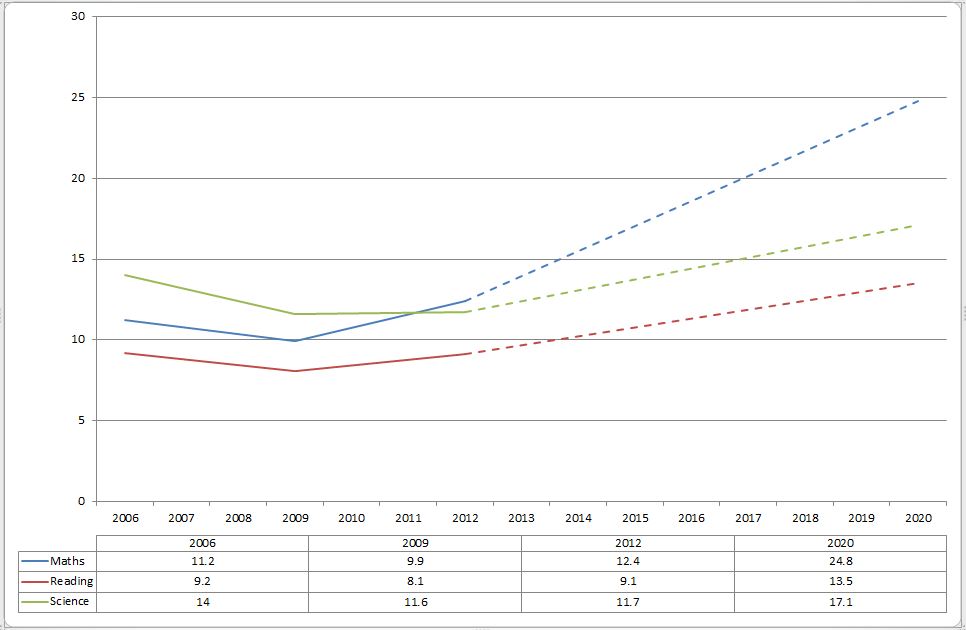
Chart 6: Improvement required to become ‘best in Europe’ for levels 5 and 6 in PISA by 2020, assuming other countries’ outcomes unchanged
.
For TIMSS and PIRLS I have used the percentage of learners achieving the advanced benchmark (625):
.
| England | Best in Europe | 5th best in world | |
| Maths (9-10) | 18 | 24
(Northern Ireland) |
30
(Japan) |
| Maths (13-14) | 8 | 14
(Russia) |
27
(Japan) |
| Science (9-10) | 11 | 20
(Finland) |
15
(Taiwan and USA) |
| Science (13-14) | 14 | 14
(England and Russia) |
14
(England and Russia) |
| Reading (9-10) | 18 | 19
(Northern Ireland and Russia) |
18
(England, Finland and Hong Kong) |
.
Morgan claimed that:
‘The best readers in this country are already the best readers in Europe – beating even the top performers in Finland, number 1 in the rankings.’
But this is inaccurate. The PIRLS 2011 national report clearly shows (page 9) that 19% of learners in Russia and Northern Ireland achieved the advanced benchmark while 18% did so in England and Finland. So England was third equal in Europe, alongside Finland.
Here is the corresponding chart, showing that the science 13-14, maths 9-10 and reading targets are reasonably attainable, but maths 13-14 and science 9-10 look a little more demanding.
.
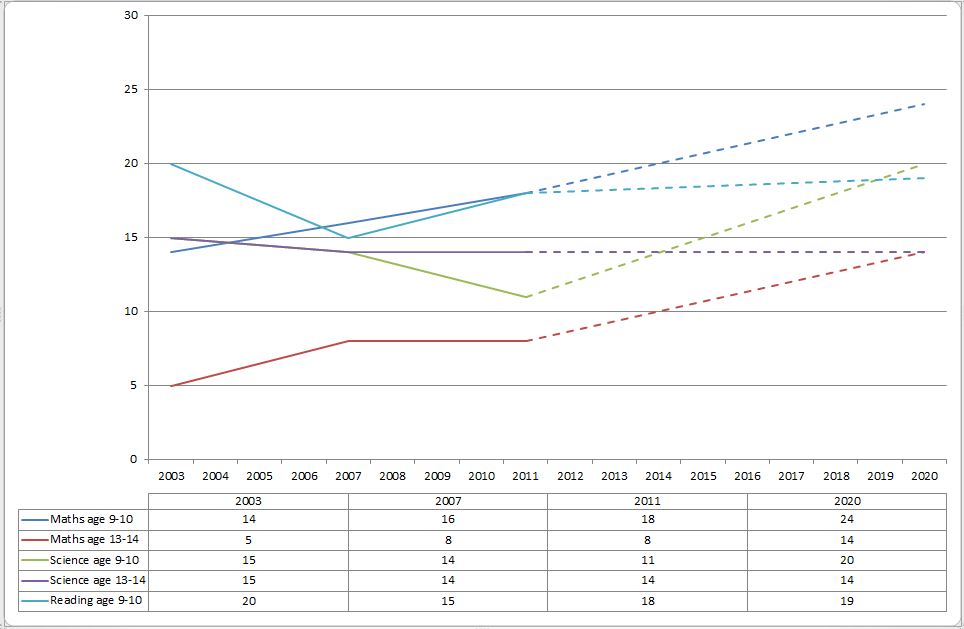
Chart 7: Improvement required to become ‘best in Europe’ for high achievers in TIMSS/PIRLS by 2020, assuming other countries’ 2011 outcomes unchanged
.
Summing up
My February 2016 Tweet predicts limited progress in PISA 2015, with our mean scores up three points in maths, up one point in reading and unchanged in science.
I erred on the side of optimism with those predictions, so would not be greatly surprised if we undershot them.
I do not expect performance at either end of the PISA attainment distribution to change materially for the better. Some deterioration would not be unlikely, so reinforcing the case in the white paper for focusing greater attention on both our lowest and highest attainers.
Those who swallow wholesale the argument that England doesn’t have a problem with the performance of its high attainers, so must concentrate exclusively on the ‘long tail’, should note that there are significant top-end gaps between England and the best in Europe on six of these eight measures. The biggest gaps at the top are similar in size to those at the bottom. Secondary maths faces a particular problem.
It would be good to see a firm commitment to improving the percentage of learners achieving PISA level 6 in particular, with new policy linked explicitly to securing that outcome.
The prospects for better results on some of the TIMSS/PIRLS measures appear slightly more positive – some limited improvement is likely but there is little reason to expect any major breakthroughs, even though these results are typically more volatile than the PISA equivalents.
When it comes to the 2020 targets I am largely sceptical. The analysis above rests on the heroic assumption that other jurisdictions will fail to improve on their 2011/2012 performance. While those at the very top of the charts will find it increasingly difficult to maintain their recent rates of improvement, some of England’s near competitors are virtually certain to outscore us.
So, as for being the best in Europe by 2020, here are my predictions…
- PISA mean scores – not a cat’s chance in hell
- TIMSS/PIRLS mean scores – it’s not going to happen
- PISA low achievement benchmarks – not holding my breath
- TIMSS/PIRLS low achievement benchmarks – no more than one or two, and only if there is sustained improvement
- PISA high achievement benchmarks – doubtful, especially at level 6, unless robust and sustained initiatives are explicitly tied to achievement of such outcomes
- TIMSS/PIRLS high achievement benchmarks – feasible for science (13-14) and reading but otherwise unlikely.
I will of course revisit these predictions in December.
.
TD
May 2016


Leave a comment