
.
This post assesses the progress of English Russell Group universities in admitting students from areas with low levels of higher education participation.
It reapplies a methodology used previously by the Sutton Trust and the Social Mobility and Child Poverty Commission (SMCPC) to measure the success of these 20 universities in recruiting young, full-time first degree entrants from low participation neighbourhoods (LPNs).
It uses data on recruitment from POLAR3 Quintile 1 (background below) as reported in the UK Performance Indicators for Higher Education (UKPIs). The analysis compares outcomes for 2010/11 with those for 2014/15 to assess progress over the last five years for which data is available.
.
Background
Back in 2004 the Sutton Trust published ‘The Missing 3,000 – State Schools Under-Represented at Leading Universities’. From time to time reference to ‘the missing 3,000’ still reappears in the fair access literature.
This calculation was based on the performance indicators then published, specifically the gap between the benchmarks for state school entry established for the ‘Sutton Trust 13’ universities and the number of state school students they actually recruited.
In 2005 the Trust published ‘State School Admissions to Our Leading Universities: An Update to ‘The Missing 3000’’ This also examined the gap between actual recruitment and the most recent benchmarks for admission from Low Participation Neighbourhoods (LPNs).
It found that the proportion of students recruited by the ‘Sutton Trust 13’ from LPNs had increased by 49% between 1997/98 and 2002/03. But comparison of actual recruitment with the benchmarks showed a consistent annual shortfall of over 500 students.
In 2013 the same methodology was applied by the SMCPC in ‘Higher Education: The Fair Access Challenge’, but only to the indicators for to state school participation and participation by those from less advantaged social backgrounds (NS-SEC 4-7).
It calculated a shortfall of some 3,700 students from state school backgrounds across all the English Russell Group universities (and just below 3,000 for the ‘Sutton Trust 13).
For NS-SEC 4-7, it estimated a shortfall of 1,750 students for English Russell Group universities (and 1,140 for the ST13).
This post undertakes the same analysis in respect of young full-time first degree entrants from low participation neighbourhoods (POLAR 3 quintile 1). It assesses progress over the last five years by comparing the results for 2010/11 with those for 2014/15.
HESA explains that:
‘POLAR3 is based on the HE participation rates of people who were aged 18 between 2005 and 2009 and entered a HE course in a UK HE provider or English or Scottish further education college, aged 18 or 19, between academic years 2005/06 and 2010/11…
…The POLAR3 classification is formed by ranking 2001 Census Area Statistics (CAS) wards by their young participation rates for the combined 2005 to 2009 cohorts. This gives five quintile groups of areas ordered from ‘1’ (those wards with the lowest participation) to ‘5’ (those wards with the highest participation), each representing 20 per cent of UK young cohort. Students have been allocated to the neighbourhoods on the basis of their postcode. Those students whose postcode falls within wards with the lowest participation (quintile 1) are denoted as being from a low participation neighbourhood.’
The methodology involves comparing the actual numbers of students recruited from POLAR3 Q1 with the number implicit in each institution’s location-adjusted benchmark within the UKPIs. This enables one to calculate the number of ‘missing students’ and the percentage increase in recruitment from this cohort required to reach the benchmark.
The LPN data is not supplied for Scottish institutions, so the analysis is restricted to the 20 current English Russell Group institutions (four of which – Durham, Exeter, Queen Mary’s and York – were not Russell Group members in 2010/11, though they are included to ensure comparability).
.
2010/11 outcomes
The results for 2010/11 are set out in Table 1, below. It shows that:
- 14 of the 20 institutions were then undershooting their location-adjusted benchmarks. Six had achieved or were exceeding their benchmarks. Newcastle was the worst performer with a shortfall of 2.3 percentage points (6.8% versus 9.1%).
- The number of ‘missing’ LPN students was also greatest at Newcastle (81), but Leeds (67), Birmingham (61), Exeter (50), Bristol (48) and Sheffield (47) were not too far behind.
- The biggest percentage improvements required were at Bristol (48 points), Oxford (46.7 points), Exeter (40 points), Cambridge (37.3 points) and Newcastle (33.8 points).
- The total intake across all 20 institutions was 3,450 and the total shortfall was 536 students, meaning that an across-the-board improvement of 15.5% was required.
.
| Institutions | Recruited % | No. recruited | Benchmark % | No ‘Missing’ | Increase required % |
| Birmingham | 5.3 | 230 | 6.7 | 61 | 26.5 |
| Bristol | 3.3 | 100 | 4.9 | 48 | 48 |
| Cambridge | 2.9 | 75 | 4 | 28 | 37.3 |
| Durham | 5.6 | 170 | 6.3 | 21 | 12.4 |
| Exeter | 4 | 125 | 5.6 | 50 | 40 |
| Imperial | 4.5 | 60 | 4.1 | -5 | -8.3 |
| King’s | 3.6 | 75 | 4.5 | 19 | 25.3 |
| Leeds | 7 | 390 | 8.2 | 67 | 17.2 |
| Liverpool | 9 | 300 | 8.9 | -3 | -1 |
| LSE | 4.1 | 30 | 3.5 | -4 | -13.3 |
| Manchester | 7.2 | 415 | 7.5 | 17 | 4.1 |
| Newcastle | 6.8 | 240 | 9.1 | 81 | 33.8 |
| Nottingham | 5.2 | 240 | 6 | 37 | 15.4 |
| Oxford | 2.8 | 75 | 4.1 | 35 | 46.7 |
| Queen Mary’s | 4.2 | 90 | 4 | -4 | -4.4 |
| Sheffield | 6.4 | 250 | 7.6 | 47 | 18.8 |
| Southampton | 5.7 | 200 | 5.7 | 0 | 0 |
| UCL | 4.1 | 90 | 4 | -2 | -2.2 |
| Warwick | 4.6 | 125 | 5.2 | 16 | 12.8 |
| York | 6.4 | 170 | 7.4 | 27 | 15.9 |
| Russell Group (Eng) | 3450 | 536 | 15.5 |
Table 1: Progress against POLAR3 Q1 benchmarks 2010/11
.
2014/15 Outcomes
The results for 2014/15 are given in Table 2 below. It shows that:
- 15 of the 20 institutions are undershooting their benchmarks. Five have exceeded their benchmarks and one is just one percentage point short. The worst offender is now Durham, with a shortfall of 2.1 percentage points.
- The largest numbers of ‘missing’ LPN students are at Durham (67), Newcastle (63), Birmingham (61), Exeter (61) and Bristol (51).
- The biggest percentage point improvements are necessary at Durham (47.9 points), Oxford (38.8 points), Bristol (34 points), Cambridge (33 points) and Exeter (31.3 points).
- The total intake across the 20 institutions is 4,320 and the total shortfall is 520 students, so an overall improvement of 12% is necessary.
.
| Institutions | % LPN | Total LPN | LA B/mark % | ‘Missing’ | % increase needed |
| Birmingham | 6.2 | 315 | 7.4 | 61 | 19.4 |
| Bristol | 3.8 | 150 | 5.1 | 51 | 34 |
| Cambridge | 3.3 | 85 | 4.4 | 28 | 33 |
| Durham | 4.4 | 140 | 6.5 | 67 | 47.9 |
| Exeter | 4.8 | 195 | 6.3 | 61 | 31.3 |
| Imperial | 3.9 | 45 | 4 | 1 | 2.2 |
| King’s | 5.3 | 140 | 5.1 | -5 | -3.6 |
| Leeds | 8.2 | 440 | 9.1 | 48 | 10.9 |
| Liverpool | 10.2 | 380 | 11.1 | 34 | 8.9 |
| LSE | 3.8 | 30 | 3.4 | -3 | -10 |
| Manchester | 8.6 | 480 | 8.5 | -6 | -1.3 |
| Newcastle | 8.7 | 340 | 10.3 | 63 | 18.5 |
| Nottingham | 6.6 | 320 | 7.6 | 48 | 15 |
| Oxford | 3.1 | 80 | 4.3 | 31 | 38.8 |
| Queen Mary’s | 4.2 | 105 | 4.6 | 10 | 9.5 |
| Sheffield | 8.7 | 355 | 8.9 | 8 | 2.3 |
| Southampton | 7.2 | 250 | 6.8 | -14 | -5.6 |
| UCL | 4 | 105 | 4.2 | 5 | 4.8 |
| Warwick | 5.4 | 140 | 5.3 | -3 | -2.1 |
| York | 7.7 | 225 | 8.9 | 35 | 15.6 |
| Russell Group (Eng) | 4320 | 520 | 12 |
Table 2: Progress against POLAR 3 Q1 Benchmarks 2014/15
.
Extent of improvement between 2010/11 and 2014/15
Comparing the results in the two tables, one can see that, over this five-year period:
- The LPN benchmarks within the UKPIs have themselves increased by an average of 0.725 percentage points. Benchmarks have fallen slightly for Imperial and LSE but have otherwise risen across the board. The biggest increases have been at Liverpool (2.2 points), Nottingham (1.6 points) and York (1.5 points).
- The percentage of students recruited from LPNs has increased at 15 of the 20 institutions and by an overall average of 0.8 percentage points. The biggest improvements have been at Sheffield (2.3 points), Newcastle (1.9 points) and King’s (1.7 points). Manchester, Nottingham and Southampton are not far behind. However, there has been deterioration at four institutions (Durham, Imperial, LSE and UCL) and no change at Queen Mary’s (Chart 1, below.)
.
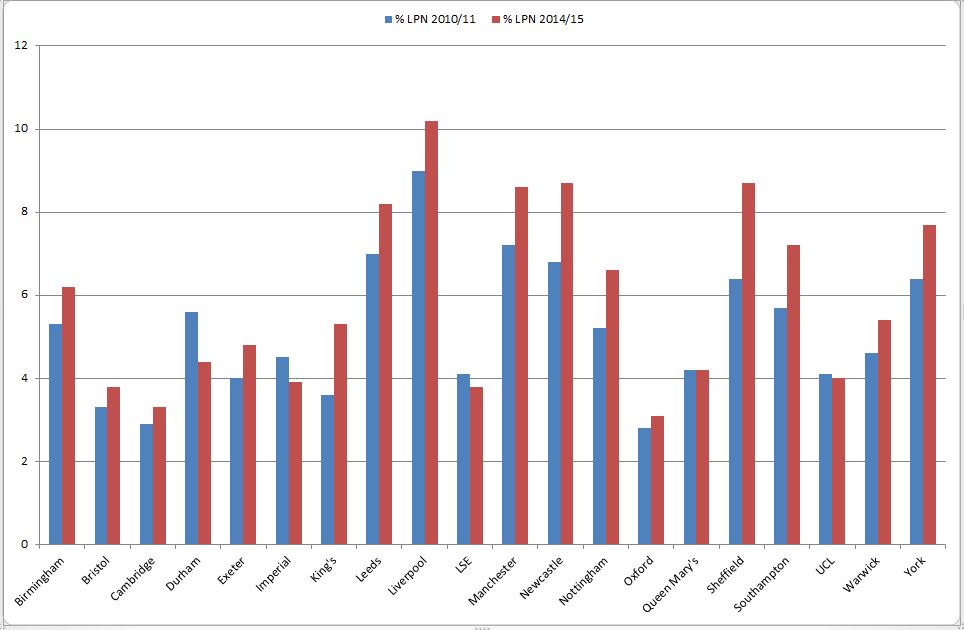
Chart 1: Comparing the percentage of students recruited from LPNs 2010/11 and 2014/15
.
- The subset of institutions achieving or overshooting their benchmarks has changed. If we give Imperial the benefit of the doubt, then only Imperial, LSE and Southampton are represented on both occasions. Liverpool, Queen Mary’s and UCL have all dropped out, to be replaced by King’s, Manchester and Warwick.
- The total number recruited from LPNs has increased by 870 (25.2%). The biggest increases have been at Sheffield (105), Newcastle (100), Birmingham (85), and Liverpool and Nottingham (80). However there have been falls at Durham (-30) and Imperial (-15) and no change at LSE (Chart 2 below).
.
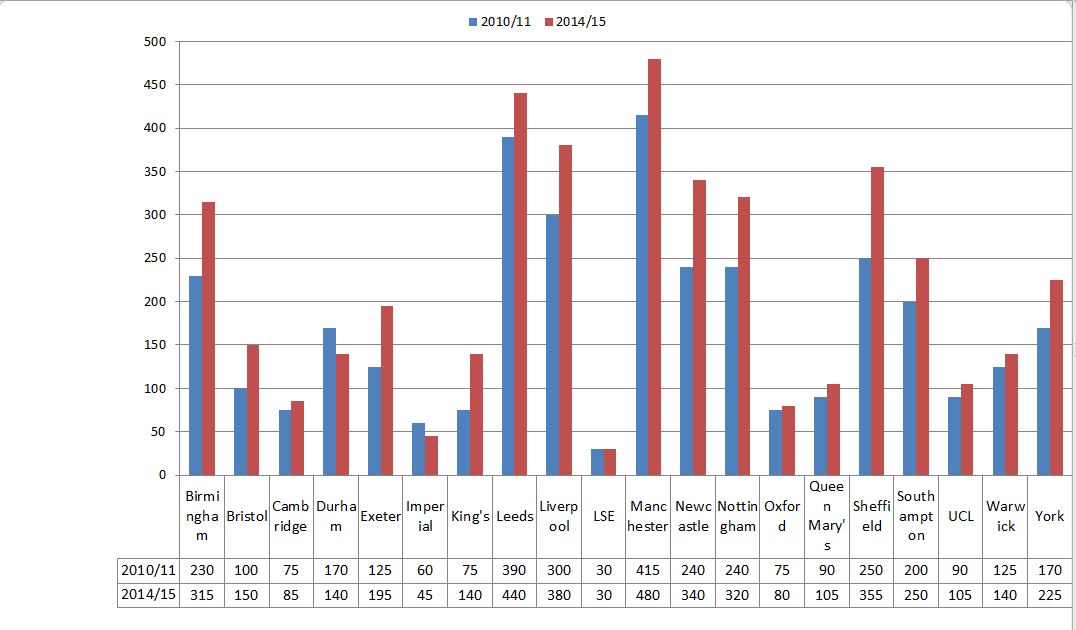
Chart 2: Comparing the number of students recruited from LPNs, 2010/11 and 2014/15
.
- Despite this, the total number of ‘missing’ students has barely changed, down a mere 16 students (3%). Big improvements at some institutions (notably Sheffield, King’s and Manchester) have been offset by substantial falls at others (Durham and Liverpool), but there are changes in single figures at eight institutions (Chart 3 below).
.
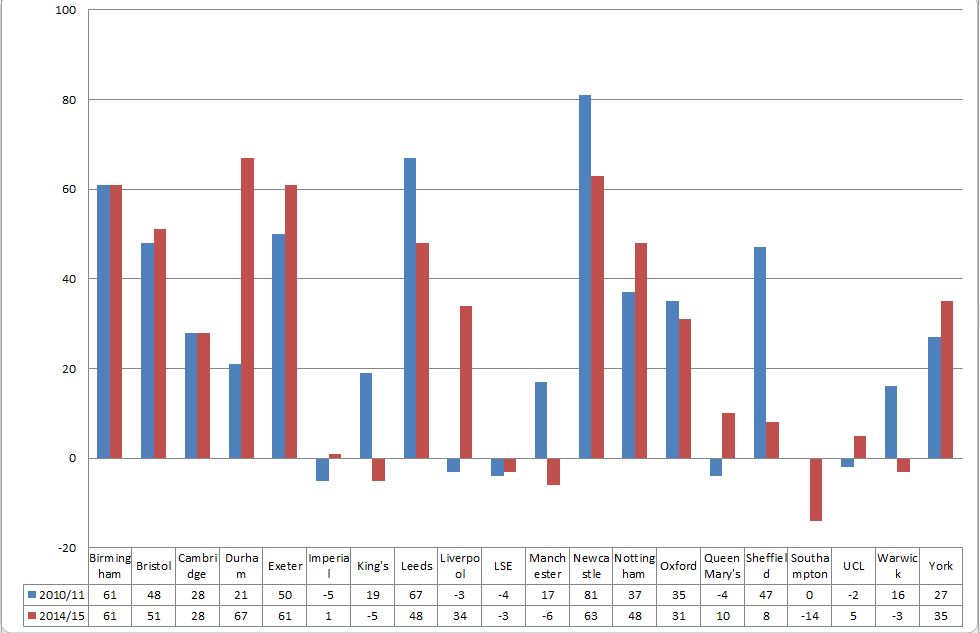
Chart 3: Comparing the number of ‘missing’ LPN students, 2010/11 and 2014/15
.
- The percentage increase required across all 20 institutions has fallen by a respectable 3.5 percentage points. Whereas in 2010/11 seven institutions faced improvements of 25 points or higher, now only five do. The position on this metric has improved at 15 of the 20 institutions, most notably at King’s, but it has deteriorated significantly at Durham (+35.5 points) and to a lesser extent at Imperial, Liverpool, LSE, Queen Mary’s and UCL (Chart 4, below).
.

Chart 4: Comparing the percentage change required to reach LPN benchmarks, 2010/11 and 2014/15
.
Conclusion
The progress made across the 20 English Russell Group universities in the last five years has been relatively limited. Something approaching 23% of the gap between the aggregated benchmarks and actual recruitment has been made up. Assuming continuing progress at the same rate it will take a further sixteen years or so to eradicate the deficit.
Moreover, the actual number of ‘missing’ students from POLAR3 quintile 1 has hardly fallen at all, because the total number of students recruited from such areas has increased.
Although the outcomes are not comparable, because of the different measures then in use and the number of universities in the sample, this is strikingly similar to the picture identified by the Sutton Trust a decade ago.
Some institutions are making relatively little progress. The situation at Durham looks particularly problematic. Oxford, Bristol, Cambridge Exeter, Birmingham, Newcastle, York and Nottingham are all well below the average percentage improvement recorded in 2014/15. With the exception of King’s, all the London institutions seem to be falling back.
It is not at all clear that this progress represents value for money, given that the Russell Group itself calculates that, in 2015/16 alone, the 20 English members will be spending a total of £234m on outreach, bursaries, scholarships and fee waivers.
The cost per additional LPN student admitted is surely excessive. The total cost of the limited improvement over five years must be fast approaching £1bn.
The new BIS guidance for the Director of Fair Access exhorts Offa to make further and faster progress with highly selective institutions. But the bigger question is whether the relatively spineless Access Agreement methodology is robust enough to achieve the change required.
POLAR3 participation has major limitations as a stand-alone proxy for socio-economic disadvantage, but it remains the preferred measure in the HE sector.
Even on this preferred measure there are serious issues with the rate of progress being achieved on Offa’s watch. If the focus is switched to FSM as an alternative proxy, how sorry is the picture then?
It is imperative that the new requirements for greater transparency in the sector include the publication of institutional data on the number of formerly FSM-eligible and pupil premium-eligible learners admitted annually.
But that still begs the question how institutions will be held accountable for failure to achieve sufficient progress. Responses to the Green Paper suggest that even limited efforts to stiffen the accountability regime will meet with the customary accusation that institutional autonomy is threatened.
Here is Durham’s response, for example:
‘Q. Do you agree that the Office for Students should have the power to set targets where providers are failing to make progress?
A. The historic strength of higher education in the UK is in part a product of institutional autonomy, and this would risk directly undermining that. It would also drive perverse behaviour away [sic], for example, from some excellent work aimed at raising aspirations and increasing access to HE in general and reduce institutional effort entirely down to entry to that specific HEI, which may not serve the individual applicant or the wider project well. It is not clear on what basis the Office for Students would make such judgements, and not clear where responsibility might then lie for resulting student outcomes.’
Personally I think a modicum of autonomy is worth sacrificing to achieve significant and lasting improvement.
.
.
TD
February 2016


Leave a comment