
.
This post:
- Reviews the most recent statistical evidence of attainment gaps between disadvantaged high attainers and their peers.
- Questions why pupil premium is having no impact on these excellence gaps and
- Proposes action to close the gaps by raising attainment, so improving the life chances of these learners.
.
Introduction
I have written extensively about the phenomenon of excellence gaps, which I have defined as:
‘The difference between the percentage of disadvantaged learners who reach a specified age- or stage-related threshold of high achievement – or who secure the requisite progress between two such thresholds – and the percentage of all other eligible learners that do so.’
The first part of this post reviews what the most recent DfE statistical publications reveal about the size of these gaps and the trend over the last few years.
It draws on:
- SFR 47/2015: National curriculum assessments at key stage 2: 2015 (revised), published on 10 December 2015 and
- SFR 01/2016: Revised GCSE and equivalent results in England: 2014 to 2015, published on 21 January 2016.
The second part examines the impact of the pupil premium to date, addressing two issues in particular:
- At what point we should expect pupil premium to reduce attainment gaps significantly and
- Why it is not yet reducing excellence gaps.
The post concludes with a series of recommendations to increase awareness of excellence gaps and to focus the system more directly on closing them.
.
Primary excellence gaps
.
Primary threshold measures
Chart 1 shows the trend in closing KS2 attainment gaps between FSM-eligible learners and all other learners in state-funded schools, at L4+ and L5+ respectively, over the three years 2013-2015.
It includes the percentage point gaps for reading, GPS (grammar, punctuation and spelling), writing (teacher assessment) and maths.
Although the SFR provides L4+ FSM data for reading, writing and maths combined, it does not give the equivalent L5+ figures, so there is no combined measure in the Chart.
.

Chart 1: FSM/non-FSM percentage point gaps at KS2 L4+ and L5+ in state-funded schools, 2013-2015
.
It is evident that:
- Across the board – in reading, GPS, writing and maths – FSM gaps are lower at L4+ than they are at L5+. Higher attaining disadvantaged learners are comparatively further behind their more advantaged peers.
- The difference between the size of the L4+ gap and the L5+ gap is relatively smaller for GPS and writing and relatively larger for reading and maths. Disadvantaged high attainers are further behind their high-attaining peers in what are arguably the twin priorities of primary education.
- The trend at L4+ is almost invariably positive, as the gaps typically fall by one percentage point a year; however there is much less movement at L5+ where the gaps have stayed much the same.
- Consequently, in all cases, the distance between the L4+ gap and the L5+ gap has increased over the period. Higher attaining disadvantaged learners are being left behind in a second sense, since any improvement is concentrated on disadvantaged learners performing at the expected level.
Chart 2 shows the comparable percentage point gaps between disadvantaged learners and all other learners in state-funded primary schools, again at L4+ and L5+ in the period 2013-2015.
It should be noted that the definition of ‘disadvantaged’ changed slightly in 2015. It continues to include ‘ever 6 FSM’ and looked after children, but the latter must now be ‘looked after children for at least one day’ or ‘adopted from care’.
Unlike the secondary equivalent (see below) the primary SFR does not discuss the impact of this change, so we must assume it is negligible.
In this case the gaps for the composite reading, writing and maths measure are included, since these are supplied within the Primary Performance Tables.
.

Chart 2: Disadvantaged/non-disadvantaged percentage point gaps at KS2 L4+ and L5+ in state-funded schools, 2013-2015
.
There is a similar pattern:
- L4+ gaps are almost invariably lower than L5+ gaps, the sole exception being the composite measure in 2013 (and that position was reversed the following year).
- The differences between the L4+ gaps and the L5+ gaps are small on the composite measure, somewhat larger for GPS and larger still for writing, maths and especially reading.
- There is a similar positive trend at L4+ and much less movement at L5+. Consequently the distance between the two has grown in all cases over the three year period.
So whether the measure is FSM or disadvantage (‘ever 6FSM’ and/or in care) it is clear that high-attaining disadvantaged learners suffer a ‘double whammy’: they are losing out both to more advantaged high attainers and to disadvantaged learners performing at the expected level.
.
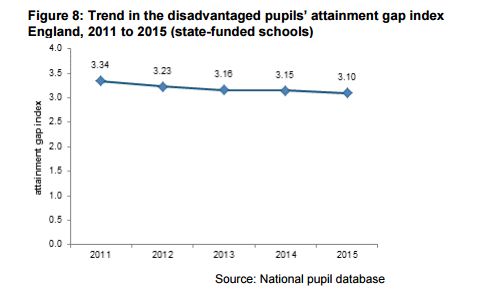
Primary Disadvantage Gap Index
For the first time this year, SFR47/2015 includes the DfE’s new Disadvantage Gap Index. This is advertised as an improvement on existing threshold measures because it takes account of attainment gaps throughout the distribution.
The primary index is derived by:
- Ranking pupils by attainment using average fine grade level in reading, writing and maths. (Average fine grade levels use marks to distinguish performance within a NC level – so for L5 there are fine grades from 5.0 to 5.9. The fine grades for the reading and maths tests and writing TA are combined to give an average figure.)
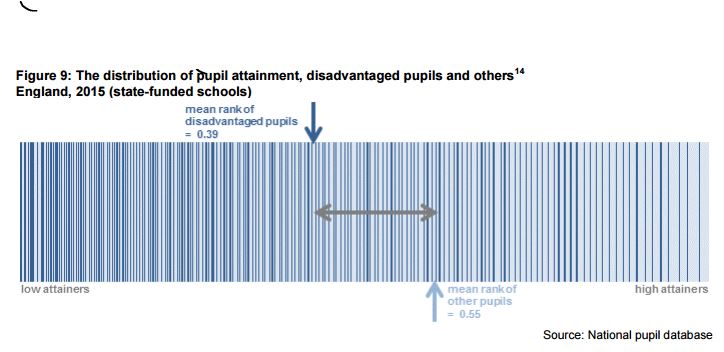
- Identifying the average rank for disadvantaged pupils (0.394 in 2015) and for other pupils (0.549 in 2015)
- Multiplying the difference by 20 – (0.549 – 0.394) x 20 = 3.10
- This represents a point on a scale from 0-10 where 0 indicates no gap at all between the attainment of disadvantaged and other learners. (The scale could theoretically turn negative if disadvantaged learners began to outscore their more advantaged peers).
The graph below shows the trend in the primary index.
.
.
According to this measure then, the gap has fallen slightly in recent years, most recently by 0.05 between 2014 and 2015. The SFR expresses this as a percentage improvement of 1.6%.
It adds that there has been a cumulative improvement of 7.1% since 2011. But it shows that this was largely attributable to the progress made in 2011 and 2012 – the percentage improvement since 2013 has been a far more modest 1.9%.
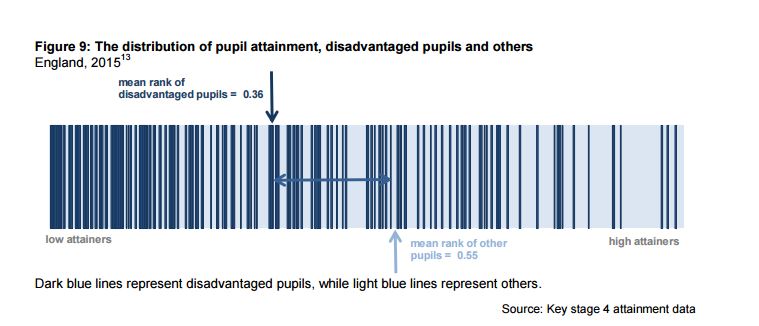
This index tells us nothing about excellence gaps, but the SFR also explores how disadvantaged and other learners are distributed across the attainment spectrum, supplying a ‘barcode’ graph to illustrate this.
.
.
There is a corresponding table (11c.) which shows the number and percentage of disadvantaged and all other pupils achieving each fine grade level.
Chart 3 shows how the percentage differs at each fine grade for disadvantaged and all other learners respectively. (A fine grade of 5.0 means ‘5.0 or higher’, while 5.1 indicates ‘5.1 or higher’ and so on.)
Whereas twice as many non-disadvantaged learners achieve a fine grade level of 5.1 or above, this rises to three times as many at a fine grade level of 5.5 or above and six times as many at 6.0.
.

Chart 3: Percentage of disadvantaged and all other learners achieving a KS2 fine point grade from 5.0 or above to 6.0 in 2015
.
The SFR uses odds ratios to illustrate these distinctions. Since 25% of disadvantaged learners achieve a fine point grade of 5.0 or above, the odds against them achieving that are 3:1 (75% no versus 25% yes). By comparison, for all other learners the odds are not far from 50:50 (53% no versus 47% yes).
The ratio between these two sets of odds is given as 2.6. The ratio increases to 3.2 at a fine grade level of 5.5 or higher and 4.1 at a fine grade level of 6.0.
Personally, I think this statistical device tends to mask the huge difference in success rates at different fine grade levels, which are much more conspicuous when the raw student numbers are used.
For example in 2015:
- Only 11,639 disadvantaged learners achieved a fine grade level of 5.5 or above compared to 70,330 non-disadvantaged learners – six times as many.
- Only 5,621 disadvantaged learners achieved 5.8 or higher, set against 39,857 non-disadvantaged learners – seven times as many
- Only 2,578 disadvantaged learners achieved 6.0 while 21,957 non-disadvantaged learners – more than eight times as many – did so.
Table 11c also provides comparable numbers and percentages in each year since 2011. This is illustrated in Chart 4, below, which compares the gradient for disadvantaged learners in each year.
It shows that, although the whole distribution shifted in a positive direction in 2011, there has been virtually no change over the last four years (indeed the 2015 line is hidden almost entirely behind those for 2012, 2013 and 2014).
.
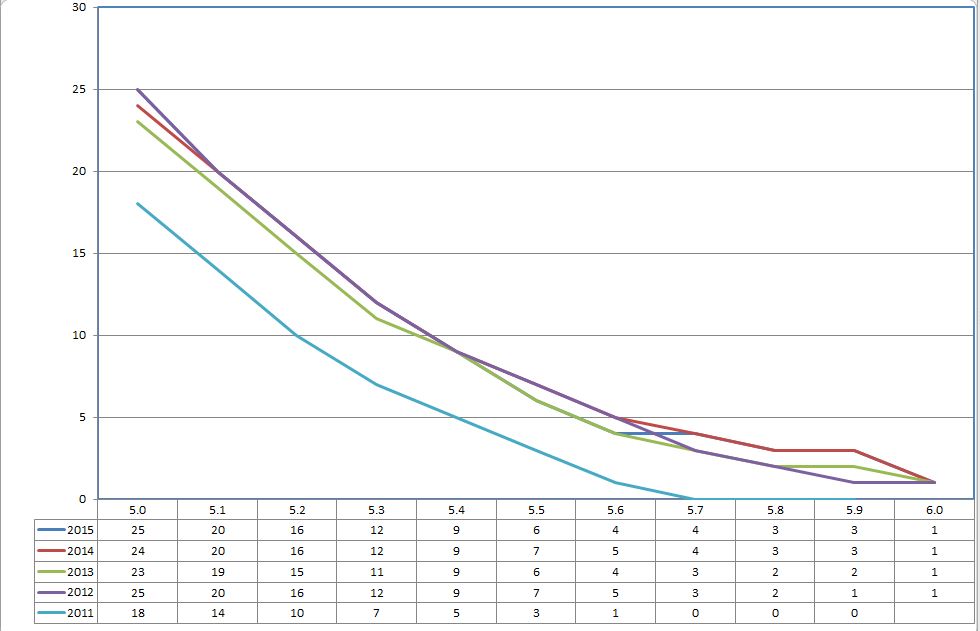
Chart 4: Percentage of disadvantaged learners achieving a KS2 fine point grade from 5.0 or above to 6.0, 2011-2015
.
Secondary excellence gaps
.
Secondary threshold measures
It is much more difficult to trace KS4 excellence gaps because no data is published about higher level attainment: we can only see the trend at standard performance benchmarks.
It would be so helpful to see what proportion of advantaged and disadvantaged learners achieved higher performance thresholds, such as 5+ GCSEs or equivalent, including GCSEs in English and maths, all at A*/A. But perhaps it is considered too alarming.
Chart 5 shows how the percentage point gaps between the performance of FSM-eligible and all other students have changed over the last 5 years at the standard performance benchmarks.
All changes have been relatively small. There have been improvements of less than two percentage points in the GCSE English and maths measure and the expected progress in English measure. Performance against the other three measures has deteriorated.
Four of the five measures have deteriorated in 2015 compared with 2014.
.

Chart 5: Percentage point gaps between FSM-eligible and all other students’ performance, state-funded schools, 2011-2015
.
Chart 6 provides the equivalent picture of trends in attainment gaps between disadvantaged and all other students over the same period.
This is slightly more positive. There has been relatively little change in any of the measures, with the exception of expected progress in English.
Over the period as a whole, four of the five measures are moving in the right direction, but previous gains are now being eroded as four of the five gaps have widened since 2014.
.
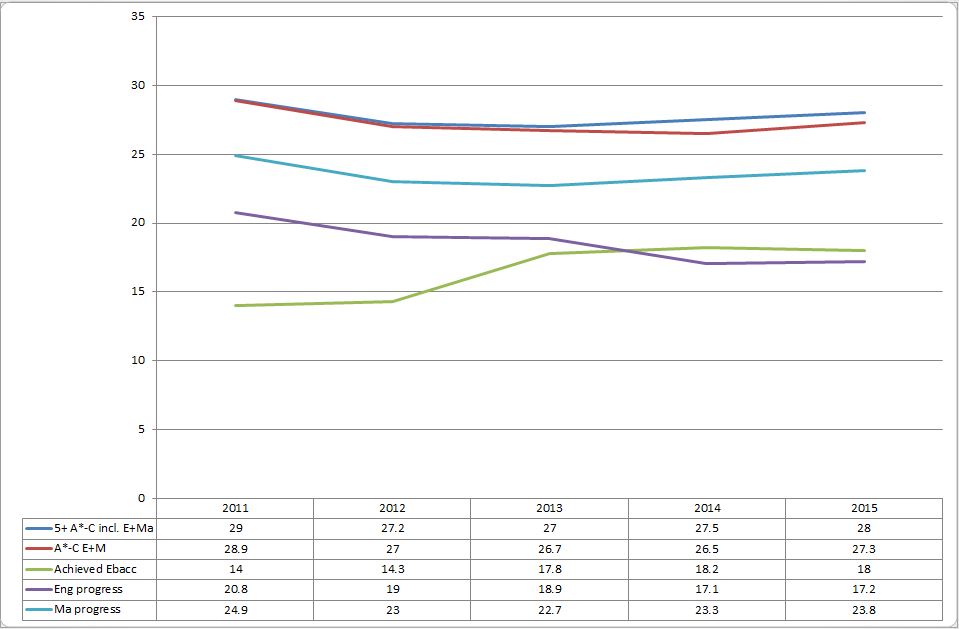
Chart 6: Percentage point gaps between disadvantaged and all other students’ performance, state-funded schools, 2011-2015
.
These comparisons carry a health warning because of comparability issues.
In 2014 the data was affected by restrictions on qualifications deemed equivalent to GCSEs and the decision to count only a pupil’s first attempt at a qualification in all EBacc subjects. Consequently some of the data was presented using an alternative 2013 ‘proxy methodology’ which removed the effect of these reforms.
The effect of the proxy methodology was, broadly, to slightly increase the FSM percentage point gaps and to leave the disadvantaged percentage point gaps largely unchanged.
There are less significant comparability issues in 2015. The first attempt rule has been extended to non-EBacc subjects, but the impact of this is marginal.
The definition of ‘disadvantage’ has also changed somewhat, in relation to children in care (see above). SFR 01/2016 says that this has brought a further 1,000 disadvantaged learners within scope, who are amongst the lowest performing.
This has some limited impact on the Disadvantage Gap Index (see below) and so presumably on the threshold measures too, but there is no quantification of the latter. We must therefore conclude that the effects are relatively marginal.
So while there may be some issues relating to comparability between the threshold gaps identified for 2014 and 2015 and those for previous years, one can assume that the threshold gaps identified for 2014 and 2015 are almost fully comparable.
.
Secondary Disadvantage Gap Index
The Secondary Disadvantage Gap Index is calculated in the same way as the primary version, except that students are ranked according to their average grade in English and maths GCSEs.
(It would have been better in my view to have used the wider Attainment 8 measure. The consultation response argues that English and maths alone are preferable:
‘…they form the most consistent attainment measure because the reforms are likely to cause changes to entry behaviour for other qualifications’.
This is not entirely convincing.)
For 2015 the secondary index stands at 3.80 (compared with 3.10 for primary) showing that the gap is comparatively bigger.
The trend is as follows:
.
| 2011 | 2012 | 2013 | 2014 | 2015 | |
| Gap index | 4.07 | 3.89 | 3.81 | 3.74 | 3.80 |
.
This is described as a 6.6% improvement since 2011. However, most of this is accounted for by the improvement in 2012: the improvement since then is a much smaller 2.3%.
And there has been a deterioration of 1.6% in 2015 compared with 2014, which takes the index back almost to its 2013 position.
We are told that the 2015 figure would have been 3.77 had the definition of disadvantage been unchanged, hence the deterioration would have been halved to 0.8% (but there would still have been deterioration).
As with the primary index there is further commentary on the distribution of disadvantaged and other students across the attainment spectrum, illustrated by a ‘barcode’ graph.
.
.
There is also a similar table in the SFR (CH3b.) showing the number and percentage of disadvantaged and other learners achieving each average grade for GCSE English and maths.
Chart 7 shows how these percentages differ at each average grade, for GCSE grades C and above. Scoring is on a linear scale, so a student achieving a B and a D would be given an average grade of C. An average grade of ‘B/C’ denotes one B and one C grade.
The pattern is very similar to that in the primary equivalent above (Chart 3, above). It shows that twice as many non-disadvantaged students achieve an average B/C grade or higher, rising to three times as many at A/B or higher and almost reaching four times as many at A or higher.
.
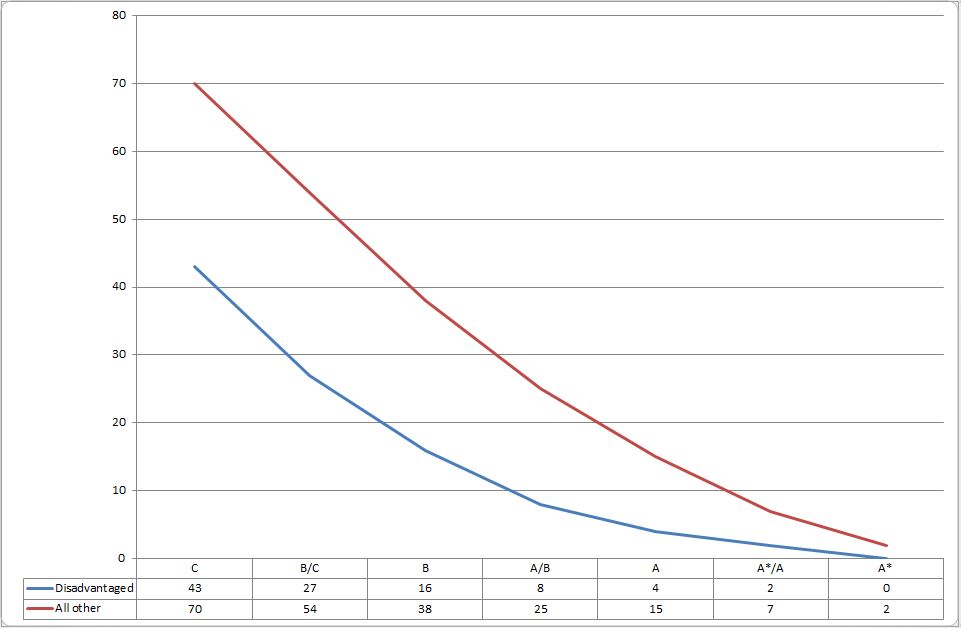
Chart 7: Percentage of disadvantaged and all other learners achieving a GCSE English/maths average grade of C or above in 2015
.
The odds ratios quoted in the SFR are: grade C and higher, 3.2, grade B and higher 3.3, grade A and higher 4.2 and grade A* 6.3.
The student numbers are again much more revealing. In 2015:
- Only 23,916 disadvantaged students achieved an average grade B, compared with 154,089 other students – more than six times as many.
- Only 5,893 disadvantaged students managed an average A grade, while 58,995 other students did so – ten times as many.
- A mere 512 disadvantaged students registered an average A* grade, set against 8,400 other students – a staggering sixteen times as many.
The table also gives comparable figures for every year since 2011. The change in distribution for disadvantaged learners is illustrated by chart 8, below. It shows some limited improvement at Grade C, but barely any change at Grade B and above.
.
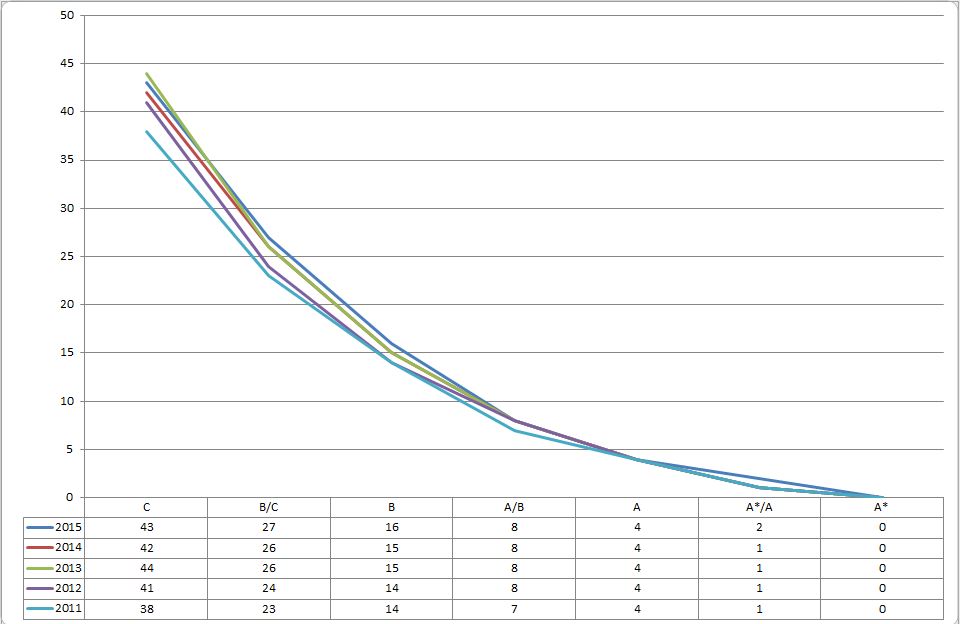
Chart 8: Percentage of disadvantaged learners achieving a GCSE English/maths average grade of C or above, 2011-2015
.
Summary of part one
Drawing all this evidence together, the overall picture indicates:
- Primary attainment gaps falling fairly consistently at KS2 L4+ but unchanged for high attainers at L5+.
- Initial progress towards closing attainment gaps on some KS4 measures at the expected level now being offset by increasing gaps on most of them.
- No greater transparency on excellence gaps for KS4 threshold measures than in previous years.
- But some new evidence emerging from the primary and secondary disadvantage gap index, showing that very few disadvantaged learners are amongst the very highest attainers at KS2 and only a tiny number manage this at KS4, in respect of English and maths at least.
- These indexes also show that there has been very little change in the representation of disadvantaged high attainers across the distribution since 2012 at KS2 and since 2011 at GCSE.
.
The limited impact of pupil premium
Given that there has been negligible improvement in excellence gaps since 2011, one has to ask why the pupil premium, an annual investment of £2.5bn or so, is apparently having so little impact on them.
There are two principal reasons, which are not mutually exclusive:
- In the secondary sector the impact of pupil premium to date is limited, even at the expected levels of attainment. Arguably the positive impact in the primary sector should also be more pronounced. Critics question how effectively the premium is being used; supporters argue that it is too soon to expect a substantive return on the investment.
- Pupil premium is insufficiently targeted at disadvantaged high attainers. The default in the system is to give low attainers higher priority and some would like to see this inequitable treatment made still more inequitable. Government rhetoric is unclear: does ‘excellence for all’ imply closing excellence gaps?
.
Mixed progress to date (across a bewilderment of measures)
It is hard to get a clear picture of the impact of pupil premium because of the variety of different indicators and statistical interpretations now in play.
The two key measures within the current DfE Impact Indicators are:
- Impact Indicator 7: the FSM gap at KS2 for L4+ in reading, writing and maths combined. The original 2011 benchmark related to reading and maths only, but this was adjusted in 2012. The 2012 baseline was a gap of 19.1 percentage points (with FSM achievement at 58.8%). This had fallen 2.2 points to 16.9 points by 2015 (with FSM achievement up 7.1 points at 65.9%). So significant positive progress.
- Impact indicator 8: the FSM gap at KS4 for GCSE grades A*-C in English and maths. The 2011 baseline was a gap of 27.4 percentage points (with FSM achievement at 35.1%) (sourced from SFR 03/2012). By 2015, the gap stood at 27.3 percentage points, down 0.1 points (FSM achievement is at 35.7%, so up 0.6 points only.) So negligible progress.
However, the June 2015 NAO report on the pupil premium focuses on two different measures
- The disadvantaged gap at KS2 L4+ for reading and maths (now reading, writing and maths. The 2011 baseline is given as 62.2% and a gap of 18.4 percentage points. DfE expects that, by 2015, significantly more will achieve the threshold and the gap will be significantly reduced. ‘Significantly’ is not defined. The full impact is expected to be realised from 2018. The latest SFR gives the 2015 position as 70% and a gap of 15.0 points (so up 7.8 percentage points and down 3.4 points respectively). Positive again.
- The disadvantaged gap at KS4 on the ‘5+ GCSEs or equivalent including GCSEs in English and maths’ measure. The 2011 baseline is given as 36.1% and a gap of 29.0 percentage points. DfE expects that, by 2020, significantly more will achieve the threshold and the gap will be significantly reduced. ‘Significantly’ is not defined. The full impact is expected to be realised from 2023. The latest SFR gives the 2015 position as 36.7% and a gap of 28.0 percentage points (so up 0.6 percentage points and down one percentage point respectively). Barely positive.
Now we have the disadvantaged gap index, which has already been incorporated into the Government’s Social Mobility Indicators. The various indicators derived from the index are set out in the table below.
The figures marked with a single asterisk are drawn from the original working paper on the index (and subsequently reproduced in the Social Mobility Indicators). Those marked with a double asterisk are from the most recent SFRs. The others are my own calculations.
.
| 2011 | 2012 | 2013 | 2014 | 2015 | Cum. | |
| Primary index | 3.34 | 3.23 | 3.16 | 3.15 | 3.10 | |
| Percentage improvement | n/a | -3.3% | -2.3%* | -0.1%* | -1.6% | -7.1%** |
| Gap indexed to NC levels | n/a | 0.43* | 0.42* | 0.42* | tbc | |
| Gap indexed to months progress | n/a | 10.3* | 10.1* | 10.1* | tbc | |
| Secondary index | 4.07 | 3.89 | 3.81 | 3.74 | 3.80 | |
| Percentage improvement | n/a | -4.4% | -2.1% | -1.8% | +1.6% | -6.6%** |
| Gap indexed to 2014 GCSE grades | 1.2* | 1.2* | 1.1* | tbc |
.
The index gives the impression of more positive progress in the secondary sector, at least until the unfortunate reversal in 2015.
But the measure is very narrow indeed, relying exclusively on English and maths GCSE outcomes. This shortcoming has to be set against the plus point that it reflects achievement across the attainment distribution rather than only at the threshold.
The index has been calculated only for disadvantage, not for FSM. Disadvantage generally gives a smaller sized gap because the disadvantaged cohort is larger and less disadvantaged on average than the FSM cohort. It would be good to see both reported so we can continue to monitor the difference between them.
The very different effects produced by different indicators are perfectly illustrated by a calculation from Education datalab that:
- On the 5+ A*-C EM measure it will take approximately 250 years to close the attainment gap but
- On the Attainment 8 measure, it will be closed by 2032!
We wait to see what measures will be adopted in the forthcoming DfE Single Departmental Plan and the Life Chances Strategy.
.
When should significant impact materialise?
The NAO takes the DfE to task for failing to explain what it means by ‘significant progress’:
‘The Department has not yet been specific enough about how it will judge whether the Pupil Premium has succeeded. As a matter of policy, the Department does not establish targets, however, in this context, it has not yet set out, either internally or externally, how it will assess whether the Pupil Premium has achieved a significant impact.’
But it does not seriously probe the claim that it will take nine years to achieve a significant positive impact in the secondary sector (compared with just four in the primary sector).
Nor does it question a second assumption that the full impact of the pupil premium will not be felt for seven years in the primary sector and 12 years in the secondary sector.
These estimates are presumably based on the calculation that this will be when the first primary cohort will have benefited throughout Years R-6 and the first secondary cohort throughout Years R-11.
They seem overly-cautious assumptions that deserve more robust analysis and challenge. I have been unable to find any deeper rationale, or convincing evidence to support them (though of course I’m happy to be pointed towards anything I’ve missed).
Otherwise it seems not unreasonable to expect a significant positive impact after:
- The first primary cohort has received pupil premium throughout KS2 (four years) and
- The first secondary cohort has received pupil premium throughout KS3 and KS4 (five years).
We might also look for positive progress towards that position after three years or so.
In sum, we might expect an improving trend in the secondary sector, matching that in the primary sector but perhaps following one year behind.
.
Problems with application and monitoring
Various issues are highlighted in the NAO report, including:
- Many schools spend some of the pupil premium on approaches that may not be cost-effective, so reducing the impact of the funding.
- Schools choose which pupils benefit from pupil premium, increasing the risk that some disadvantaged learners miss out (see below).
- Ofsted inspection may prompt a recommendation that a pupil premium review is commissioned, but inspection can be infrequent. Such reviews are optional and reviewers are in short supply. Such intervention is described as ‘weak’ and the report suggests the possibility of mandatory reviews.
- There is no routine monitoring of the pupil premium statements that schools are required to publish – and only one third of schools comply fully with these requirements.
- There is no routine monitoring of the quality or content of pupil premium reviews either.
- There is considerable between-school variation in closing attainment gaps, suggesting that national performance could be significantly improved by concentrating efforts on schools where the gaps are largest.
I could trace no formal response to the NAO report.
Some of the same ground was covered by the Public Accounts Committee in its brief September 2015 Report.
The official response to this:
- Rejects the recommendation that it should define ‘significant progress’ arguing that it will instead benchmark changes in the size of England’s attainment gap against those in other countries through PISA and TIMSS.
- Accepts the recommendation that DfE should ‘develop the necessary mechanisms to make sure schools use effective interventions’ and ‘make pupil premium reviews mandatory for those schools identified as using the pupil premium ineffectively’. However, the action it describes falls short of mandatory reviews.
- Accepts the recommendation that it should support the sharing of best practice. As part of this process it published a Briefing for School Leaders in November 2015. This refers in passing to the Sutton Trust Report ‘Missing Talent’ (fully critiqued here).
.
Limited targeting of disadvantaged high attainers
In their original 2013 survey report on the most able in non-selective secondary schools, Ofsted reported that:
‘Few of the schools visited used the pupil premium funding to support the most able students from the poorest backgrounds’.
Their most recent assessment, in 2015, suggests that still only a third of non-selective secondary schools are using pupil premium effectively for this purpose.
The NAO reports the results of its own survey which showed that
‘32% of schools do not provide additional support to disadvantaged pupils who are already identified as ‘able’ (meaning likely to meet minimum attainment targets). This is in spite of evidence that, without support, such pupils often fall behind equally able peers.’
Those schools failing to make appropriate provision will have been encouraged by the position taken by some national organisations.
During 2015 Teach First led a consortium of partners in calling for a reduction in the value of the pupil premium allocation for disadvantaged high attainers. I mounted a campaign challenging these arguments.
More recently there are welcome signs that Teach First is moving away from this position.
.
.
The Report of the Pupil Premium Summit organised by the Sutton Trust (June 2015) observed:
‘It is important that the premium is paid for all disadvantaged pupils, without discrimination between low and high attainers. Doing otherwise – as some have suggested – would be bad for social mobility. It would also send perverse signals to successful schools. Recent Sutton Trust research has shown that disadvantaged but bright pupils fall behind at school, and it is important that schools use their premium funding where appropriate to provide stretching lessons for able disadvantaged pupils as well as helping low attainers to make good progress. This is also particularly important in improving later access to higher education.’
While the Government has shown no signs of being attracted by the original Teach First proposition, its own rhetoric has been difficult to interpret.
In her speech to the Pupil Premium Summit, Secretary of State Morgan re-articulated her belief in ‘excellence for all’:
‘And, as I have said before, that work has got to be about more than ‘closing the gap’. Pupils that lag behind their peers should be encouraged to reach their full potential and to go further than simply ‘catching up’. If we would want our own children to study the core academic subjects, we should extend that opportunity to every child. The soft bigotry of low expectation has no place in today’s schooling.’
But this position has been criticised by the Social Mobility and Child Poverty Commission (SMCPC) for diluting the focus on closing attainment gaps.
Their 2015 State of the Nation Report said:
‘While the Commission welcomes the Government’s commitment to continue to fund the Pupil Premium, we are deeply concerned at suggestions of a move away from a focus on narrowing the attainment gap, replacing this with an objective of raising standards for all. …disregarding the objective at a national level would be a major mistake. Raising standards for everyone is a reasonable and ambitious aim, but the lesson has been learnt by previous governments that without specific focus on the poorest children within schools, progress across the board stalls. The evidence is absolutely clear that the particular disadvantages faced by the poorest children drag their actual attainment way below their potential, which is evident from the bottom to the top of the attainment distribution, not just in the proportion of children achieving the basics…
… For these reasons, the Government’s attention must remain unwaveringly on both raising standards across the board, and on the gap between the richest and the poorest. A move away from this approach would adversely affect both practices and outcomes, and the system itself would fail to fulfil its potential.’
One section of Morgan’s speech was headed ‘supporting bright pupils from poor backgrounds’. The only policy mentioned was the manifesto commitment to extend the EBacc to (almost) all learners.
.
Summary of part two
So, drawing this second set of strands together:
- There is respectable progress in the primary sector and very limited progress in the secondary sector, both at the expected levels. However the rate of progress varies according to the measure selected.
- We should already be seeing some positive impact from the pupil premium in the secondary sector as well as the primary sector. Significant positive impact should be imminent.
- It follows that, by now, we should also expect evidence of at least some positive impact on excellence gaps in both sectors. But there is no sign of such impact.
- There is also evidence to suggest that progress is hampered by: effective practice being confined to a minority of schools; limited intervention to remedy poor practice; a sense within the system that disadvantaged high attainers are somehow a lower priority; some lack of clarity in Government rhetoric; and too few targeted, co-ordinated interventions to redress the balance.
.
Recommendations
As part of its strategy to ‘create more opportunities to stretch the most able’ in line with the commitment in the Conservative Manifesto, the Government should take full cognizance of excellence gaps, ensuring that:
- Accountability measures are in place to monitor progress towards closing them at school, local authority, regional and national level (including within the Government’s own impact measures).
- There is a renewed commitment to transparency in the publication of attainment data, so all can monitor national, regional and local performance over time against high attainment benchmarks for all relevant primary, secondary and post-16 measures, including separate reporting for disadvantaged/all other learners and FSM/all other learners respectively.
- Benchmarking analysis of England’s progress in closing attainment gaps through PISA and TIMSS is published, includes differential reporting for the highest achievement levels in those assessments and incorporates the PISA concept of resilient students.
- Pupil premium is targeted more effectively towards high attainers, as part of wider efforts to strengthen the intervention process in line with NAO and PAC recommendations. Pupil premium reviews should be mandatory for schools not using the premium effectively to support high attainers. All reviews should address the point explicitly. As a last resort schools could be required to distribute their pupil premium funding as a personal allocation for each eligible learner.
- The EEF runs a competition to develop and evaluate programmes and whole school strategies designed specifically to support disadvantaged high attainers. The EEF also ensures that all funded trials evaluate carefully the impact on this group.
- Localised support programmes are introduced to increase the supply of high attaining disadvantaged learners at KS2. Providers might include teaching school alliances, selective schools, maths hubs etc. Pupil premium funding might be used for this purpose. This would be ‘nursery slopes’ provision leading up to…
- A national framework to support disadvantaged high attainers from KS3 to HE entry, in schools and colleges alike. The full range of out-of-hours providers would operate as a market regulated through the framework. Schools and colleges would help students to tailor a coherent programme to meet their needs. Student participation (open access at first, then subject to progress) would be funded primarily through an annual £50m pupil premium topslice, but with full involvement and financial contributions from the post-16 and HE sectors.
By this means we can support disadvantaged high attainers to achieve outstanding A level results, so they can compete successfully for places at highly selective universities.
It is deeply worrying that no more than 50 formerly FSM-eligible students progress annually to Oxford and Cambridge.
The key to shifting that stubborn statistic lies in the fact that only 2,600 disadvantaged learners achieve a KS2 fine grade average of 6.0 and a mere 512 manage an A* average in GCSE English and maths.
We need to increase supply at the end of KS2 but, above all, concerted action is required to bear down relentlessly on the KS2-4 attrition rate while carefully nurturing ‘late developers’.
.
TD
February 2016


Leave a comment