.
This post casts a critical eye over the proposals for widening participation and fair access in the Higher Education Green Paper.
It succeeds an earlier post – ‘Can we expect a rocket boost for fair access?’ (October 2015) – that discussed what was known of the Government’s intentions prior to publication.
.
Publication
BIS published the Green Paper: ‘Fulfilling our potential: teaching excellence, social mobility and student choice’ on Friday 6 November.
Fridays are not normally selected for high profile Government announcements.
There were reports that a launch originally scheduled for Thursday 15 October was delayed to coincide with a Prime Ministerial speech:
‘There are suggestions that one factor behind Mr Cameron’s growing focus on widening participation is that, in the wake of the government’s decision to abolish child poverty targets which were being missed, universities are one of the key fields where the Conservatives can demonstrate a commitment to social mobility.’
But this speech did not materialise.
In the event, publication was heralded by
- A brief Parliamentary Written Statement
- A press release ‘Student choice at the heart of new education reforms’ and
- Simultaneous publication of two BIS Research Papers, both associated with widening participation and fair access:
‘Socio-economic, ethnic and gender differences in higher education participation’ and
‘Understanding progression into higher education for disadvantaged and under-represented groups’.
A brief summary of these research findings is included at Annex A below.
.
Defining Terms
The Green Paper does not define terms, so here is my interpretation of some important distinctions.
One must distinguish widening participation – improving participation in higher education as a whole – from fair access – securing a fair distribution of places within higher education institutions, including within selective universities.
When the Green Paper refers to the most selective higher education institutions it means the top-third of institutions ranked by mean UCAS tariff score from the top three A level grades of entrants. This gives a set of 50 or so ‘higher tariff’ institutions which, while broadly consistent, changes at the margins from year to year.
It does not differentiate within this this ‘top third’ of institutions, although some are far more selective than others.
The Green Paper adopts the student lifecycle approach embodied in the National Strategy for Access and Student Success.
Alongside access (a portmanteau term for widening participation and fair access) this features:
- Retention and student success – continuation rates within higher education and differences in higher education attainment.
- Progression to further study, to further employment or within employment – differences in experiences, outcomes and progression beyond higher education.
The Green Paper discusses socio-economic disadvantage and under-representation but not the complex relationship between them.
Socio-economically disadvantaged students are under-represented in higher education, but so are students from some ethnic backgrounds, disabled students, those who are carers and those have been in care. Students with one or more of these characteristics are not necessarily disadvantaged, but they are significantly more likely to be so.
Ethnicity is central to the Green Paper, but disability and care/caring history do not feature.
These characteristics do not operate in isolation. They impact on each other, as well as on socio-economic disadvantage. They are also influenced by gender, hence there is particular concern about white male students from disadvantaged backgrounds.
Socio-economic disadvantage is typically distinguished through area or household proxies, or occasionally a hybrid measure. Receipt of pupil premium and eligibility for and receipt of free school meals are common household proxies.
Different proxies reveal different effects. A student from a disadvantaged household may or may not live in a disadvantaged area and both variables may be significant.
The Green Paper relies exclusively on a different area-based proxy which distinguishes the higher education participation rates in the localities from which students enter higher education.
This measure, called POLAR , divides local areas into five quintiles according to the proportion of 18 year-olds who enter higher education aged 18 or 19. The areas with the lowest participation rates – quintile 1 (so the bottom 20% of the distribution) – are the most disadvantaged, while those in quintile 5 (the top 20% of the distribution) are the most advantaged.
The Green Paper switches between different categorisations of ethnic background, according to the source of the evidence. One version distinguishes White, Black, Chinese, Indian, Other Asian and Other/Unknown. Another has 12 categories: White British, Other White, Black African, Black Caribbean, Other Black, Indian, Pakistani, Bangladeshi, Chinese, Other Asian, Mixed and Other.
It does not discuss distinctions based on socio-economic class, or the level of disadvantage in the school or college attended prior to HE entry, or its record of HE destinations, or whether it was independent or state-funded.
Disadvantage can be tackled from different starting points.
A decade or so ago in the schools sector there was a decisive shift away from perceiving such issues through the lens of minority ethnic background, towards a foregrounding of socio-economic disadvantage. Minority ethnic background was seen as a factor impacting on disadvantage rather than vice versa. By and large this remains the default perspective in that sector.
The recent policy direction for access and student success appears to point in a subtly different direction. In the Green Paper neither socio-economic background nor ethnicity is foregrounded, but both are accorded parallel significance.
.
Scope for improvement
The Green Paper is typically upbeat about recent progress but offers only two statistics to back this up:
- ‘This year we have seen record entry rates by young people from disadvantaged background [sic] of 18.2%’
This comes from the UCAS End of Cycle Report 2014 (p73) and refers to 18 year-old entrance rates for students from England, POLAR2 quintile 1.
- ‘In 2014, young people from the most disadvantaged areas were 40% more likely to enter higher tariff institutions than three years earlier’.
This is also from the UCAS End of Cycle Report (p78) and relates to the same population. The relevant paragraph continues:
‘This is the greatest proportional increases [sic] for any background. The relatively low entry rate for the most disadvantaged group means that these large proportional increases in entry rates translate to a [sic] less than a single percentage point increase in the rate over this period (from 2.3 per cent to 3.2 per cent) compared to over two percentage points for the most advantaged group.’
These two statements relate to participation and fair access respectively. There is nothing about the later stages of the student lifecycle.
However, the subsequent analysis of shortcomings roves across this lifecycle beginning with the later stages:
- Excepting Chinese students, minority ethnic retention rates are lower than for white students. Non continuation rates for black students are highest with 11.3% no longer in higher education after one year.
- There are ‘pronounced differences’ in degree attainment and progression to employment and further study between white students and some BME groups which cannot be explained by prior attainment.
- HE outcomes for black students – degree completion, degree classification, progressing to highly skilled employment or further study – are ‘significantly below what would be statistically expected when other factors are accounted for’.
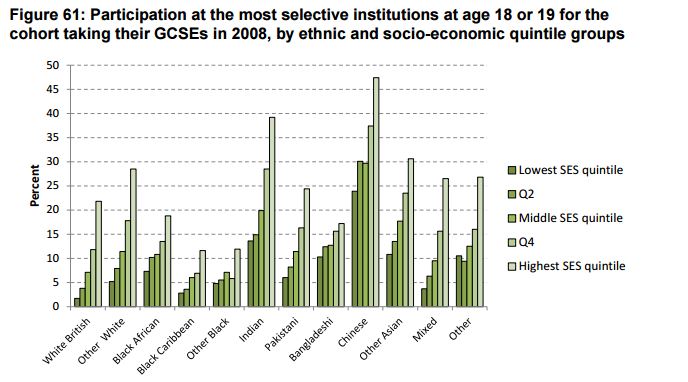
- On the other hand only 10% of white males from the most disadvantaged backgrounds enter HE, compared with significantly higher rates for the most disadvantaged men from Black Caribbean (20%), Indian (nearly 50%) and Chinese backgrounds (over 60%).
- While the key factor determining progression to HE is prior attainment, aspirations and attitudes are more significant for white male disadvantaged learners than for their disadvantaged BME peers.
- Progression of disadvantaged students to high tariff universities needs further attention since only 3% of disadvantaged 18 year-olds enter such institutions compared with 21% of those from the most advantaged backgrounds.
Put crudely, minority ethnic differences are distinguished in the later stages of the lifecycle, while socio-economic differences are associated exclusively with access and participation.
This treatment suggests three main priorities, though the Green Paper does not describe them as such:
- Improving retention and outcomes of BME students, especially Black students.
- Widening participation amongst white male disadvantaged students and
- Fair access to selective HE for disadvantaged students per se (ie without reference to their secondary characteristics).
.
Targets
The combined introduction and executive summary recommits to two targets:
- doubling the percentage of people from disadvantaged backgrounds entering higher education by 2020, compared to 2009
- increasing the number of black and minority ethnic (BME) students going into higher education by 20% by 2020.
Chapter 4, dealing with social mobility and widening participation glosses these:
‘The Prime Minister has set challenging goals in this area; setting out an ambition to doubling [sic] the proportion of people from disadvantaged backgrounds entering higher education by the end of this Parliament from 2009 levels. This would mean raising the participation rate of disadvantaged young people from 13.6% in 2009, to 27.2% in 2020. The Prime Minister has also committed to increasing the number of BME students going into higher education by 20% by 2020. This latter goal is part of the measures in the Prime Minister’s 2020 vision for BME communities.’
The 2020 vision is encapsulated in this speech given by the Prime Minister on 25 April during the Election Campaign. (The brief references to HE are about 12 minutes into the video.)
The first target is also described more loosely as ‘an ambition’ and the target date is given as ‘the end of this Parliament’, so presumably by May 2020.
Given what we know of the evidence base, there is an obvious mismatch between these targets and the de facto priorities:
- The first target focuses on widening participation for disadvantaged students when the core issue is the participation of one particular subset – white male disadvantaged students. The target could be achieved by increasing participation amongst female and BME disadvantaged students, so worsening the relative position of the priority group.
- The second target is focused on widening participation for BME students when their participation rates already exceed those of White students. Some ethnicities are performing exceptionally well in this regard (see Annex A).
- The BME target should arguably address the retention and outcomes issues that impact on the BME student population. But the National Strategy for Access and Student Success reveals that there are similar problems with retention rates and outcomes for students from POLAR quintile 1 (see Annex B), so presumably both should be addressed.
- There is no fair access target relating to progression of disadvantaged students to high tariff universities. Given the evidence at Annex A, there might be an argument for prioritising White students over some minorities
.
Analysis of the targets
The 2009 participation rate for disadvantaged students is given as 13.6% and the 2020 target as 27.2%. This appears to be the entry rate for English 18 year-olds from POLAR2 quintile 1. The UCAS End of Cycle Report 2014 (p74) gives the trend from 2006 to 2014.
The 2014 figure is 18.2%, so the target, goal or ambition is 9.0 percentage points higher, equivalent to an increase of almost 50%.
The chart below reproduces the data for quintiles 1 and 5 respectively, adding a trend line which shows that such an increase is exactly in line with the trend. Continued progress at this rate will secure the target.
.
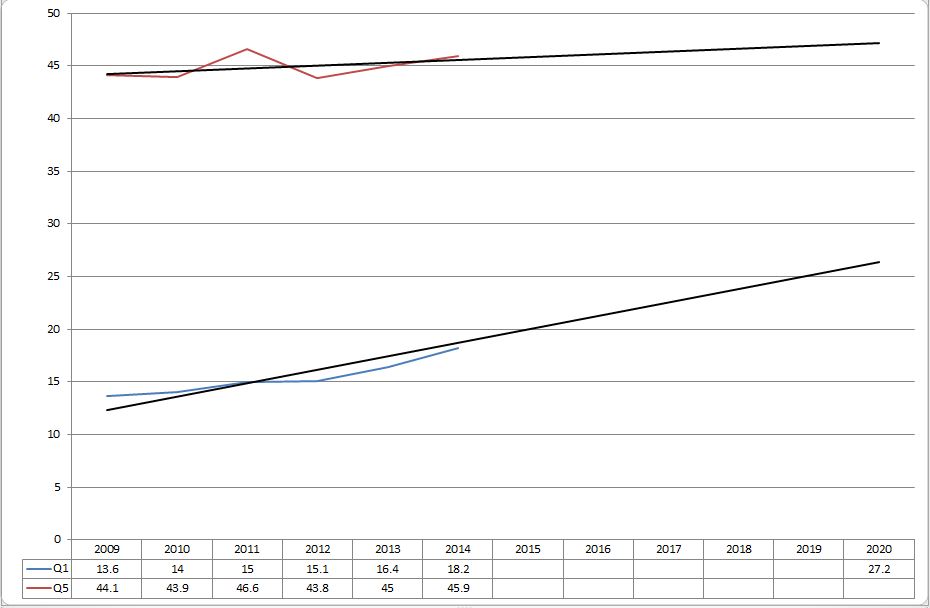
Chart 1: 18 year-olds in England, entry rates by POLAR 2 quintiles 1 and 5, 2009-2014 plus trend to 2020
.
Rather confusingly the equivalent target in Offa’s 2015-2020 Strategic Plan uses a different metric, based on an adjusted POLAR3 classification. It applies a 2011-12 baseline of 20.4% participation by quintile 1 and projects an improvement to 36.0% (so 15.6 percentage points) by 2019-20.
Hefce also bases its analysis on this data, which features in the National Strategy for Access and Student Success.
More recently, Hefce has argued:
‘Assuming that the target relates to the most disadvantaged group which we define as those in POLAR3 quintile 1, a preliminary analysis undertaken by HEFCE suggests that the participation rates for this group would need to increase by two to three percentage points per year to meet this target, whereas the trend to date has been an increase of one percentage point per year.’
Even allowing for the difference between POLAR2 and POLAR3, I cannot reconcile this statement with the graph above.
The Green Paper says nothing about the comparable trend for other quintiles and there is no parallel target to reduce progression gaps between advantaged and disadvantaged learners, even though Offa has such a target in its Strategic Plan.
Hefce says:
‘Meeting the Prime Minister’s target would go some way to closing the gap, assuming that the participation rates for the most advantaged students remains relatively stable.’
The POLAR 2 trends in the chart above suggest a gap of some 20 percentage points by 2020, seven points lower than in 2014.
.
No baseline is provided for the BME participation target and there is no analysis in the Green Paper. Offa has no target of this nature either.
The Equality Challenge Unit’s ‘Equality in higher education: statistical report 2015, part 2: students’ gives the AY2013/14 percentage of UK-domiciled BME students attending HE in England as 23.2% compared with 76.8% white.
On the basis of these 2013/14 figures, a 20% increase would mean some 70,000 more BME students by 2020, giving a total of around 416,000.
Further analysis is provided at Annex A, which summarises the key findings in the research published alongside the Green Paper and at Annex B, which supplies other data relevant to the discussion above.
.
Policy response
Alongside the targets, the Green Paper proposes a seven-fold plan.
.
First, new guidance to the Director of Fair Access on the progression and success of particular groups ‘where there is evidence that more needs to be done’.
One assumes that this will reflect the putative national priorities, including the progression of disadvantaged students to selective universities.
There is a risk that, through access agreements, universities will be pushed further towards introducing a clutch of small-scale programmes addressing the differing needs of a variety of sub-populations across the student lifecycle.
This may divert them from the core task of improving participation and access for socio-economically disadvantaged young people.
Such fragmentation is likely to be inefficient and comparatively ineffective, particularly when resources are increasingly scarce.
Would institutions be expected to work towards full parity across the student lifecycle for each minority ethnic group within each POLAR quintile?
.
Second, a UUK social mobility advisory group will be formed. It will be charged with developing new and/or innovative approaches building on existing good practice and will submit an interim report to the Minister for Universities by December 2015.
At the time of writing, UUK has not yet announced the membership nor has BIS published a remit. It will be hard-pressed to complete an interim report by the year end.
It is essential that universities take full ownership of these issues, but several different perspectives must also be taken into account, including those of students, schools/colleges and the third sector. It is not yet clear how consultation will generate a balanced perspective.
The group’s remit and membership should be published immediately. Its proceedings should be transparent; its conclusions published. The remit should clarify the relationship with Offa and with the Social Mobility and Child Poverty Commission.
Innovation is much-needed and to be welcomed, but will be limited by the availability of resources, hence the Spending Review outcome is critical.
.
Third, UCAS will consult on the feasibility of introducing ‘name blind’ applications from September 2017.
This was pre-announced (as a fait accompli) by the Prime Minister in a 26 October Guardian article:
‘Some research has shown that top universities make offers to 55% of white applicants, but only to 23% of black ones. The reasons are complex, but unconscious bias is clearly a risk. So we have agreed with UCAS that it will make its applications name-blind, too, from 2017.’
UCAS has promised consultation on ‘a wider range of changes which could impact applications from BME students’.
It is important to set this in context. There is evidence of an issue with offers to BME applicants that is particularly pronounced in Russell Group universities.
On the other hand most BME groups are now more likely on average to attend high-tariff institutions than their white counterparts.
Any name-based discrimination is pointing in the opposite direction. Of course it should be addressed but we must accept that, once eliminated, it will only increase the gap between white and BME admissions, for advantaged and disadvantaged students alike.
.
Fourth, the Green Paper cites one aim of the Teaching Excellence Framework (TEF) as being to:
‘…recognise those institutions that do the most to welcome students from a range of disadvantaged backgrounds, support them to remain on their courses (such students are often at a higher risk of dropping out) and help them to progress to further study or a high skilled job’
Those institutions that do well will be permitted initially to raise fees in line with inflation (and beyond that in subsequent years if they achieve at higher levels).
There will be a subsequent technical consultation to determine TEF metrics but the Green Paper proposes that:
- To be eligible for the TEF, institutions should have measures in place already to ‘facilitate the access and success of disadvantaged groups’, evidenced by an access agreement or equivalent.
- Metrics will recognise institutions’ ‘track record’ on access and outcomes for disadvantaged and under-represented groups. The wording suggests there will be separate reporting for disadvantaged and under-represented respectively.
- Institutions might also supply additional evidence of their own including ‘the extent to which students are recruited from diverse backgrounds, including access agreements where relevant’.
- One precondition for institutions applying for a higher level assessment should be ‘fulfilling widening participation expectations in recruiting…and supporting students from disadvantaged backgrounds’.
The initial proposals for a TEF are complex and unclear. Perhaps the UUK advisory group should be asked to clarify those that fall within its remit.
If the TEF is to unlock institutions’ freedom to charge higher fees, there must be safeguards to ensure that a proportion of that income is reinvested in fair access.
.
Fifth, an Office for Students is proposed. The introduction/executive summary says that, amongst other things this would unify activity to widen access and improve student success. It would incorporate the functions of Offa and the Director for Fair Access, including his annual report to Parliament.
It would also be funded by subscriptions from higher education providers.
The Green Paper says
‘We propose to join up the different activities focussed on widening participation to generate maximum impact, and further explore how best activity could be funded
The Director might have extended powers to impose targets on providers that are failing to make sufficient progress. He might also be able to reject access agreements – he can already do so if they are seriously breached but this would extend the power to instances where targets are missed ‘without good reason’ – although:
‘…this would need to be balanced by the desire to protect autonomy over admissions and academic freedom’.
There is no further reference to how widening participation funding might be brought to bear alongside access agreement funding.
Hefce’s Student Opportunity Grant is known to be vulnerable to cuts imposed by the Spending Review.
In its response to the Green Paper, Offa warned:
‘In implementing these changes, it will be crucial not to dilute or subordinate fair access to other, possibly conflicting, priorities. It will therefore be important that, within the proposed new Office for Students, the Director of Fair Access is able to operate free from conflicts of interest and ‘sector capture’
.
Sixth, exploration of a legal power to
‘require bodies providing a service connected with the provision of higher education to provide relevant data and information to help better target efforts on widening access and success’.
When this was first announced UCAS appeared to suggest that such a power was unnecessary, but others are concerned that UCAS support comes with too many strings attached.
Here is Boliver:
‘…researchers need access to complete and detailed anonymised UCAS data. For the past few years, UCAS has been unwilling to share this kind of data with researchers.
UCAS recently agreed it would begin sharing data from 2017, but only for applicants who actively opt-in to share. If a substantial number of applicants don’t choose to opt-in, researchers will only be able to access data for a distorted sample of applicants and any research results may well be inaccurate.’
There are important issues of transparency here. All data should be published, anonymised as necessary.
The apparent suggestion in the Green Paper that universities might be excused from FoI points in precisely the opposite direction.
.
Seventh, there will be cross-departmental work ‘to address some of the root causes of inequality of access and outcomes for different groups in higher education’.
This includes work with DfE to ensure access to information and guidance and to
‘…explore how we can further raise aspirations and attitudes in particular for white males from disadvantaged backgrounds’.
Further work to establish a joined up approach is essential. BIS and DfE favour different indicators of disadvantage and of HE selectivity. DfE’s experimental destination statistics should be folded into the mix.
Given the critical significance of raising attainment it is troubling that this is not highlighted as a core focus of joint work.
.
Overall judgement
Respondents are asked what other measures the Government should consider.
The five substantive commitments to date:
- Updated guidance to the Director of Fair Access plus (possibly) powers to impose targets
- Consultation on ‘name blind’ applications
- Incorporation in TEF metrics unlocking permission to charge higher fees
- A potential legal power to provide data and
- Unspecified cross-Departmental work on IAG, aspirations and attitudes
do not together add up to a convincing strategy or, indeed, a particularly radical departure from the status quo.
As noted above, the Green Paper’s targets and apparent priorities are pointing in different directions and require reconciliation.
The spectre of the spending review hovers over all efforts to develop a more radical and innovative strategy. There should be more explicit acknowledgement that the Government needs to reduce significantly both administrative and programme costs. New solutions must be achievable within reduced central budgets and reflect pressure on HE institutions to meet a higher proportion of costs.
Despite this cost-cutting agenda, the Green Paper seems to endorse the existing hydra-headed approach, pushing HE institutions towards ever more fragmented programmes that address the diverse needs of small sub-populations across the entire student lifecycle.
There is a strong case for a national restatement of priorities, committing to a strategy that is focused first and foremost on tackling the consequences of socio-economic disadvantage, qualified where necessary by the impact of additional student characteristics.
.
What is missing?
The Green Paper does not address the gap-narrowing objective in the National Strategy for Access and Student Success:
‘Narrow the gap in the participation rates in and across higher education between advantaged and disadvantaged groups.’
No mention is made of contextualised admissions although the National Strategy said:
‘OFFA and HEFCE both appreciate that academic autonomy is an essential aspect of our HE system and that the freedom of institutions to control their own admissions criteria is an important part of this. However, all highly selective universities should consider whether they could make better use of contextual information in their admissions process and critically examine their entry requirements, polices and processes to ensure that they are not unduly disadvantaging certain groups of students that have the potential to succeed on their programmes.’
The Green Paper has nothing to say about strengthening collaboration and partnership between schools, colleges and higher education institutions, a central theme of the National Strategy:
‘Following the interim national strategy report, BIS asked HEFCE and OFFA to look at establishing a new approach to support institutional collaboration which will build on the conclusions set out in this national strategy:
- outreach is most effective when delivered as a progressive, sustained programme of activity and engagement over time
- outreach programmes need to be directed towards young people at different stages of their educational career and begin at primary level
- the effective delivery of outreach programmes requires the full, adequately resourced involvement and engagement of HEIs, FECs and schools
- the collaborative provision of outreach delivers significant benefits in terms of scale, engagement, co-ordination and impartiality
- progression pathways for learners with non-traditional or vocational qualifications need to be clearly articulated
- outreach to mature learners depends on good links with FECs, employers and the community
- without good advice and guidance, outreach is impoverished and less effective.’
Hefce has made a start of sorts with funding for National Networks for Collaborative Outreach (NNCOs), but these are little more than information sharing systems. Much more is needed.
For example:
- A proper national tracking system that is not plagued by the timelags involved in matching school and HE datasets. This would be based on universal adoption of the Unique Learner Number (ULN) and should give HE institutions all the data necessary to inform HE access decisions. Work is already under way but almost certainly requires championing across Government at Ministerial level.
- A national collaborative framework that enables all high attaining disadvantaged young people to undertake a coherent long-term personalised support programme across secondary, post-16 and higher education. This would improve attainment and, where necessary, address aspirations, behaviours and any other obstacles to progression.
- A personal budget to fund such programmes, met partly from a £50m pupil premium topslice, with pro-rata funding from the post-16 and HE access budgets. This would establish a much cheaper version of the ‘fairness premium’ once briefly advertised by the Liberal Democrats in the early days of the Coalition.
.
TD
November 2015
.
.
Annex A: Supporting research
‘Socio-economic, ethnic and gender differences in higher education participation’ is by Crawford and Greaves. The overall conclusions are that:
- Ethnic minority students are substantially more likely to go to university than White students; students from the highest socio-economic backgrounds are also substantially more likely to go to university than those from the lowest; and females are slightly more likely than males to go to university.
- All of the gender differences and most of the socio-economic differences can be explained by ‘a limited set of individual and school characteristics’ plus prior attainment. Most of the differences in participation by ethnicity can also be explained for participation in selective, higher tariff universities.
- But differences in the wider participation rate by ethnicity – increasing over time and larger for EAL students and London residents – are not explained by the data. It ‘seems plausible that aspirations and expectations might play a role’.
A briefing note from IFS adds a useful gloss.
- All BME groups are now, on average, significantly more likely to go to university than White British students. This is true of the overall populations and four of five socio-economic quintiles. In the case of the highest socio-economic quintile, White British participation is higher than for Black Caribbean and other Black students, but lower than all other BME categories.
.

.
- Most BME groups are now, on average, more likely to attend high-tariff universities than White British students, but the differences are smaller. In the case of the lowest socio-economic quintile, White British students are least well represented but, in the case of the highest, White British students are better represented than Black African, Black Caribbean, Other Black and Bangladeshi students.
.
.
- While the latter differences ‘could generally be better explained by differences in school attainment’, the former occur despite the lower prior attainment of Black, Pakistani and Bangladeshi students. Other factors must explain this difference.
- These results do not necessarily contradict findings that BME applicants are less likely to receive offers for selective universities than equivalently qualified White British applicants because the larger proportions applying outweigh the impact of proportionately fewer offers.
‘Understanding progression into higher education for disadvantaged and under-represented groups is by CFE Research (Bowes et al). It explores the reasons other than attainment for differential rates of HE participation by gender and ethnicity particularly amongst lower socio-economic groups.
The overall conclusions are that:
- KS4 attainment is ‘the major determinant of HE applications’, but aspirations and attitudes help to explain participation gaps attributable to gender, ethnicity and disadvantage. Significant gaps in participation by ethnicity remain unexplained.
- The removal of barriers to participation is not sufficient to secure it. The decision-making process has different stages. Key factors influencing decision making include ‘the support of family, peer and education networks, positive attitudes toward education, the provision of relevant and timely information, advice and guidance and an appreciation of the cost and benefits of a chosen pathway’.
- These factors are ‘intersectional’, making it impossible to determine their extent and relative influence on an individual at a given point in time. Hence:
‘potential interventions which look to widen access to higher education are likely to be most effective if developed within a coherent framework or programme. Such a programme would look to incorporate interventions that have both ‘push and pull’ features, addressing barriers while simultaneously promoting the benefits for different groups of individuals.’
Moreover:
‘interventions will be required across the entire student lifecycle, from an early age right through to the point at which decisions about higher education participation are made. Strategies will necessarily cross government departmental boundaries, with higher education institutions playing a vital role’.
As for differences in participation by ethnicity this:
…could be due to a number of factors, although it should be stressed that more research would be needed to explore this in more detail: ethnic minority groups may not be as influenced by working class habitus as White British groups; they may have a more positive attitude toward higher education as a means of gaining wider cultural capital and moving into higher socioeconomic groups; White British students, in particular, may be more nervous about higher education being a economically sound investment in terms of employability and see it more of a risk.’
.
.
.
Annex B: Supplementary analysis
Dealing first with disadvantaged progression to high tariff universities, Chart 2 combines the percentages for POLAR2 quintiles 1 and 5 adding trend lines. The actual 2014 percentages are 3.15% for the former and 21.3% for the latter.
The trend projects a target of 4.0% for quintile 1 by 2020, up some 27% on the 2014 figure of 3.15%. This compares with a projection of 23.7% for quintile 5.
Quintile 1 improves at a faster rate but from a much lower base, while the gap between the participation rates increases by some 1.6 points. On the other hand, the ratio between them falls from 7:1 to 6:1.
.
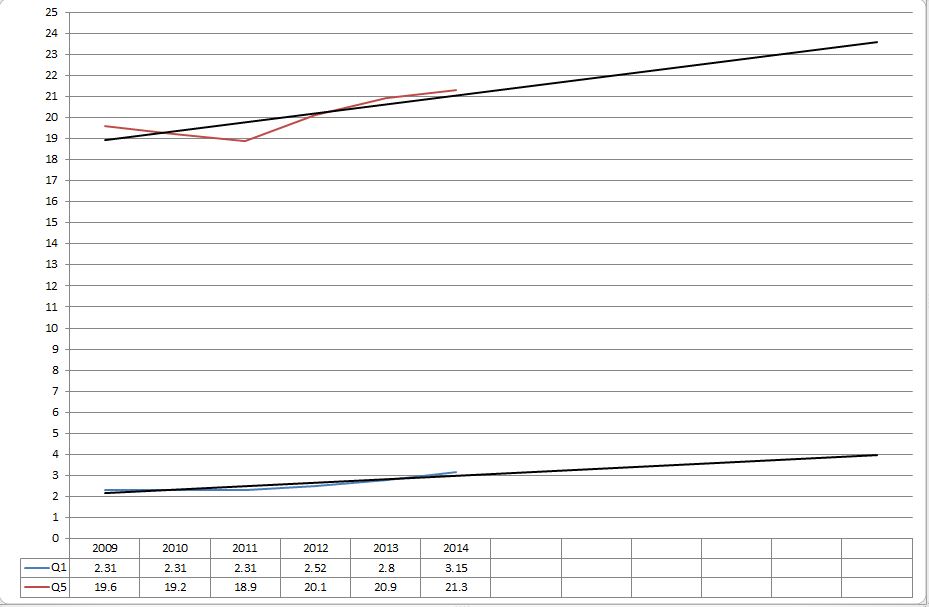
Chart 2: 18 year-olds in England, entry rates to higher tariff providers for POLAR 2 quintiles 1 and 5 (and trend to 2020).
.
Offa’s Strategic Plan contains a more ambitious target that uses the same metric and baseline, though rounded to 3.2%. It projects the quintile 1 success rate to reach 5.0% by 2019-20, which would be above the trend.
Offa also has targets for quintile 2 progression and reducing the ratio between quintile 5 and quintile 1. The latter is to reach 5:1 by 2019-20.
.
The figures in the Green Paper for BME retention and outcomes come from the National Strategy for Access and Student Success, which draws them in turn from a variety of earlier Hefce publications.
The National Strategy supplies the chart below showing differential retention rates. I have not found these figures updated beyond 2010-11.
.
.
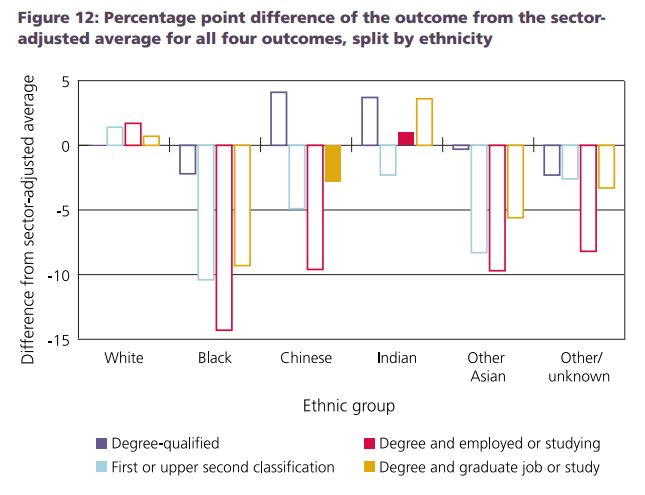
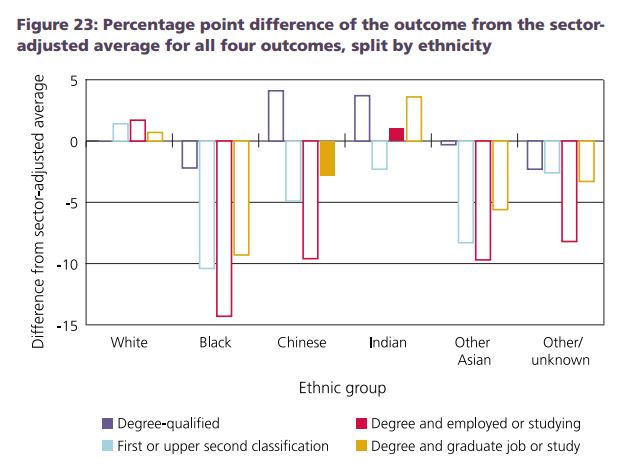
An equivalent chart, reproduced below, shows outcomes for students who entered courses in 2006-07. Black students are below the sector adjusted average on all four measures. The ‘sector adjusted average’ is what would be statistically expected when other characteristics are accounted for, including prior attainment.
.
.
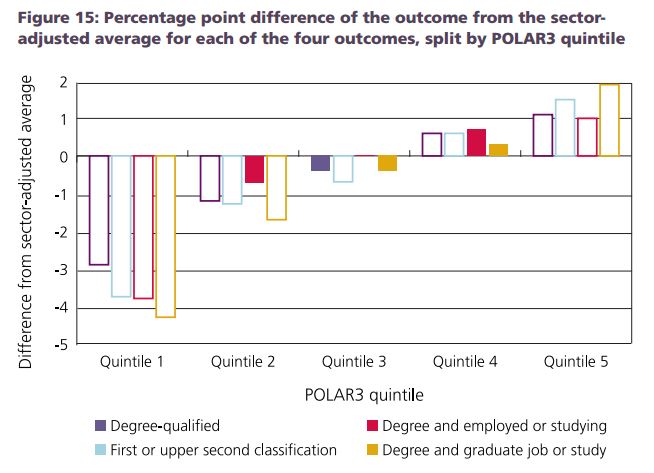
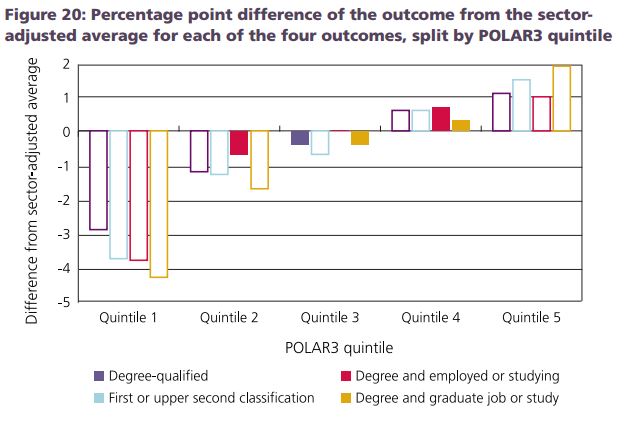
But the same is true of those from low participation areas. Here are the equivalent diagrams from the National Strategy relating to POLAR3 quintiles.
.
.
.


Leave a comment