.
This post provides updated information about trends in Key Stage 2 Level 6 performance.
.
Background
Two further datasets have been released since I published a summary of Provisional KS2 Level 6 results for 2015 (August 2015):
- 2015 static national transition matrices for KS1-2 reading, writing and maths were added to RAISEonline on 29 October.
- L6 test entries for 2015 and preceding years were included in SFR42/2015, published on 5 November.
This permits further analysis of KS2 L6 attainment and progress.
.
L6 test entries
Chart 1 shows annual L6 test entries since 2012.
I had expected that confirmation of the abolition of L6 tests would depress 2015 entries severely across the board. But only in the reading test did entries fall below their 2014 level – and then only slightly.
This dip may have been more attributable to problems with the 2014 test: the drastically lower success rate last year remains unexplained.
In total there were over 300,000 L6 test entries in 2015, up by more than 25,000 compared with 2014.
Entries for the L6 maths test increased by almost 10%, while entries for the GPS test climbed 18%. These were smaller increases than last year, but they demonstrate the substantial and sustained popularity of these two tests, regardless of abolition.
.
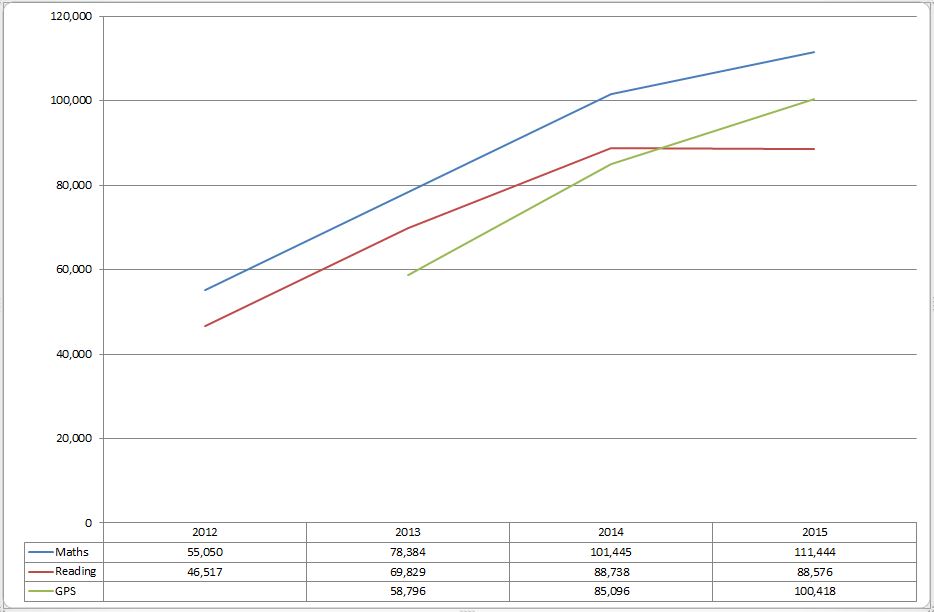
Chart 1: Level 6 test entries 2012 to 2015
.
L6 test passes
Chart 2 shows changes in the number of L6 test passes since 2012. It is important to note that the 2015 outcomes are still provisional and so subject to change.
In both maths and GPS the number of passes has levelled off much more than the number of entries. Compared with 2014, there have been increases of 6.2% in GPS passes and of only 1.9% in maths passes.
The number of reading test passes has consistently underwhelmed. Yet there was an increase of 56% compared with 2014, albeit from a desperately low base. Even so, the number of reading test passes has not matched its high point in 2013.
.

Chart 2: Level 6 test passes 2012 to 2015 (2015 figures are provisional)
.
L6 test pass rates
Chart 3 shows changes in pass rates since 2012.
In reading the pass rate has increased by over 50% compared with 2014, but is still not much more than half the rate achieved in 2013.
Given pass rates this low, it is astonishing that entries for the reading test have held up so well. A test which fewer than one in fifty entrants pass is clearly not fit for purpose and deserves to be ignored.
By comparison, pass rates have fallen noticeably in both maths and GPS. In maths there has been a drop of 3.6 percentage points while GPS is down 2.5 percentage points.
So although schools have continued to enter pupils for these two tests in ever-increasing numbers, pass rates have not kept pace. Why?
It could be that schools have decided to enter a larger proportion of pupils with marginal chances of success. This seems unlikely since all entrants are expected to have demonstrated attainment above L5.
An alternative explanation may be that teaching in this final year of the tests has not been quite as effective. Perhaps impending abolition has removed some of the pressure to demonstrate continuous improvement in pass rates.
.
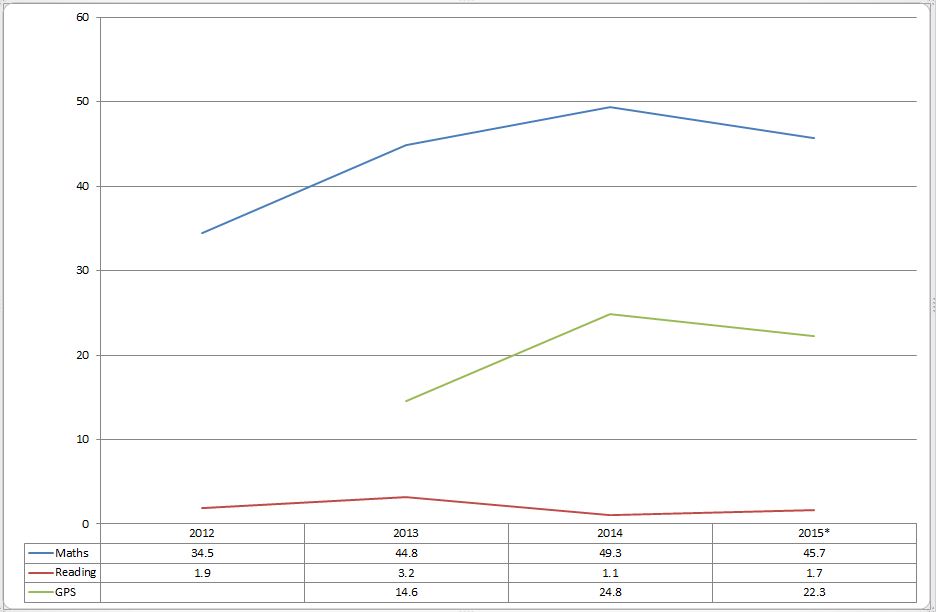
Chart 3: Level 6 test pass rates, 2012 to 2015 (2015 figures are provisional)
.
Comparing L6 test and L6 TA outcomes
For the sake of completeness I have reproduced the chart below, included in my earlier post, which compares the numbers awarded L6 via test and TA respectively in reading and maths.
This shows the comparative similarity in numbers achieving L6 maths by test and TA and – by contrast – the huge discrepancy between test and TA at L6 in reading.
In 2015 ten times as many pupils were successful via TA than via the test (In 2014 the ratio was even higher at 14:1). The same discrepancy was not evident for L5 reading, where 2015 pass rates were within 2 percentage points of each other.
This is further evidence – if evidence were needed – that L6 reading assessment was problematic. Clearly schools had a very different notion of ‘level 6ness’ to that embodied in the test. If efforts were made to change this, they proved resoundingly unsuccessful
.

Chart 4: Numbers achieving L6 in maths and reading by test and TA respectively, 2012 to 2015
.
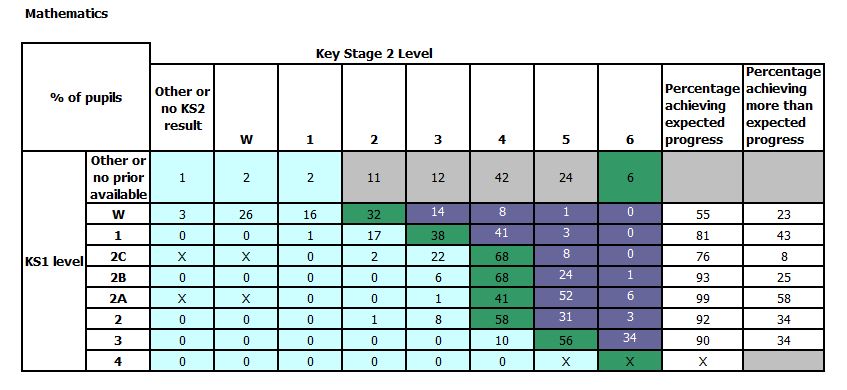
Progress from KS1 L3 to KS2 L6 in 2015
The 2015 static national transition matrices for KS1-2 reading, writing and maths are reproduced below.


.
Points to note:
- In all three assessments the percentage of pupils with KS1 L3 making expected progress is lower than the percentage of pupils with KS1 L2 doing so. The gap is 6 percentage points in reading, 4 percentage points in writing and 2 percentage points in maths.
- 11% of KS1 L3 pupils record a single level of progress in reading, as do 7% in writing and 10% in maths. In all three assessments the percentage of pupils making a single level of progress from KS1 L3 is higher than the percentage doing so from KS1 L2.
- The percentage of pupils with KS1 L3 achieving KS2 L6 ranges from 1% in reading to 13% in writing and 34% in maths. Whereas very small numbers with KS1 L2 achieved KS2 L6 in reading, 1% did so in writing and 3% did so in maths.
- Progress rates varied significantly for the handful of pupils recording KS1 L4. In reading only 7% made the expected progress to KS2 L6, whereas 77% did so in writing. The outcomes in maths have been suppressed.
.
Comparing transition matrices for 2013, 2014 and 2015
The chart below shows how progress made from KS1 L3 has changed since 2013 in each of the three assessments. This data is drawn from the transition matrices for each of these three years.
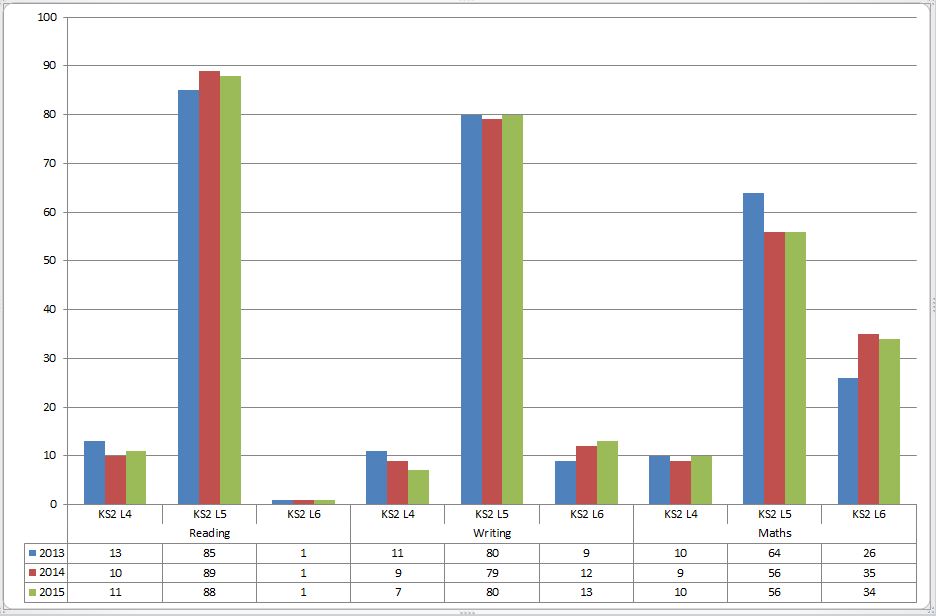
Chart 5: Percentages of pupils with KS1 L3 achieving KS2 L4, L5 and L6 in reading, writing and maths, 2013 to 2015
.
Points to note:
- In reading the proportion of pupils with KS1 L3 achieving KS2 L6 has remained miniscule. The proportion making only a single level of progress has remained broadly stable, but rose again in 2015 having fallen slightly in 2014.
- In writing the proportion of pupils with KS1 L3 achieving KS2 L6 has increased by four percentage points, though the increase in 2015 was only a single point. The proportion making only a single level of progress has decreased by four percentage points at a steady rate of two points per year.
- In maths the proportion of pupils with KS1 L3 achieving KS2 L6 increased by nine percentage points in 2014, only to fall back one point in 2015. Meanwhile, the proportion making only a single level of progress has remained broadly stable, falling a percentage point in 2014 but regaining that point in 2015.
- Other than in writing, where all trends are broadly positive, there has been fluctuation over the period. The fact that one in ten KS1 high attainers are making limited progress is a continuing cause for concern, especially since the effect is almost invariably more pronounced for them than it is for those with KS1 L2. The comparative impact of inflated KS1 assessment and under-challenge during KS2 is unknown.
.
Conclusion
We are almost ready to bring down the curtain on L6 assessment. All that remains is confirmation of the provisional 2015 pass rates and publication of a breakdown by pupil characteristics.
As high attainers face the uncertain future of single tests and (average) scaled scores, what are the learning points from the old regime?
For me they are threefold:
.
- KS2 L6 assessment relied on exposure to the former KS3 programmes of study. While reading was always problematic, significant proportions of high attainers were successful, particularly in maths but increasingly in writing/GPS too.
The new KS2 programmes of study are more demanding than their predecessors, so there is some extra headroom, but there is also a movement towards preventing high attainers from anticipating the KS3 PoS.
Whereas the national curriculum advocates ‘depth before pace’, to ensure that pupils are secure in their learning before moving on to new material, the rival mastery mantra is ‘all depth and no pace’.
Mastery thinking has seemingly influenced the content of KS2 tests and the nature of KS2 teacher assessment standards, so creating a fault line between the national curriculum and its assessment.
The new assessment regime apparently imposes an age-related performance ceiling on all learners which is not necessarily in the best interests of high attainers. Giving schools autonomy to respond flexibly to different learners’ needs is by far the better option.
.
- Despite continuing debate about the nature of progress, indeed whether it exists at all, the Government is adamant that progress matters. As Secretary of State Morgan said in a recent speech:
‘But to be really confident that students are progressing well through primary school, we will be looking at the assessment of pupils at age seven to make sure it is as robust and rigorous as it needs to be…
… My focus is on ensuring we can be confident every child is making the progress we know they can.’
The language of progress will change under the new assessment regime, as comparisons are based on the scaled scores achieved by pupils grouped according to similar prior attainment at KS1 and (potentially at least) at the new reception baseline.
Progress, or lack of it, will be expressed as a positive or negative integer showing how a learner compares with his peers. Individual progress scores will not be reported to parents. This approach is supposed to give equal weight to progress by all learners, regardless of their prior attainment.
But there is a risk that reporting will mask a continuing trend for high attainers to be more likely to underachieve relative to their prior attainment. It is not yet clear to me how this will be discernible under the new arrangements, as it is presently through the transition matrices.
.
- Since success at KS3 will no longer be recorded through end-of-KS2 statutory assessment, there is a risk that it will be frozen out of in-school summative assessment too.
But schools should continue to give pupils opportunities to exceed age-related expectations, including by moving into the next programme of study. They should incorporate this into their assessment systems, according it equal value to ‘working at greater depth within the existing standard’.
To incentivise such behaviour and to support the effective transition of high attainers from primary to secondary school, end-of-KS2 achievement within the KS3 programmes of study should be independently assessed and accredited through a Certificate of Exceptional Performance.
This would counterbalance the Government’s investment in Year 7 retakes while also helping to fulfil an outstanding Conservative Manifesto commitment:
‘We will make sure that all students are pushed to achieve their potential and create more opportunities to stretch the most able.’ (p35)
.
TPD
November 2015


Leave a comment