
.
Having spent several years bewailing the limited availability of national data on excellence gaps, I was pleasantly surprised to discover that RAISEOnline has just published transition matrices showing the progress made by disadvantaged learners from KS2 to KS4.
It is regrettable that this data has been released only at the point when an entirely new assessment regime is about to be introduced, but better late than never.
It might provide a baseline of sorts against which to judge the future size of excellence gaps – and how effectively they are identified and reported – once the new assessment measures are in place.
You probably need reminding of my working definition of excellence gaps in an English context:
‘The difference between the percentage of disadvantaged learners who reach a specified age- or stage-related threshold of high achievement – or who secure the requisite progress between two such thresholds – and the percentage of all other eligible learners that do so.’
This should apply as much under the new system as the old, though there are outstanding questions about exactly what progress will mean, particularly in the primary setting, and how it will be assessed.
The new transition matrices are in the RAISEOnline library, although I found it impossible to download them as an external user.
I am most grateful to Twitter user Jasmin Masih, who provided a link.
.
.
They show progression from KS2 sub-levels to GCSE outcomes at KS4 for a variety of different subjects.
This brief analysis is confined to the matrices for KS2 English to KS4 English and KS2 maths to KS4 maths. It looks exclusively at the highest-attaining populations of advantaged and disadvantaged learners – those with a Level 5a at the end of KS2.
The measure of disadvantage is eligibility for the pupil premium (via ‘ever 6 FSM’ or being a looked-after child).
Parallel matrices are supplied for disadvantaged and non-disadvantaged learners. Both pupil numbers and percentages are provided, though the former are suppressed if they are 1 or 2. Some secondary suppression has also been applied to avoid disclosure.
Separate matrices have been published for each year from 2011 to 2014. I have reproduced the 2014 editions below (click on them to magnify).
.
.
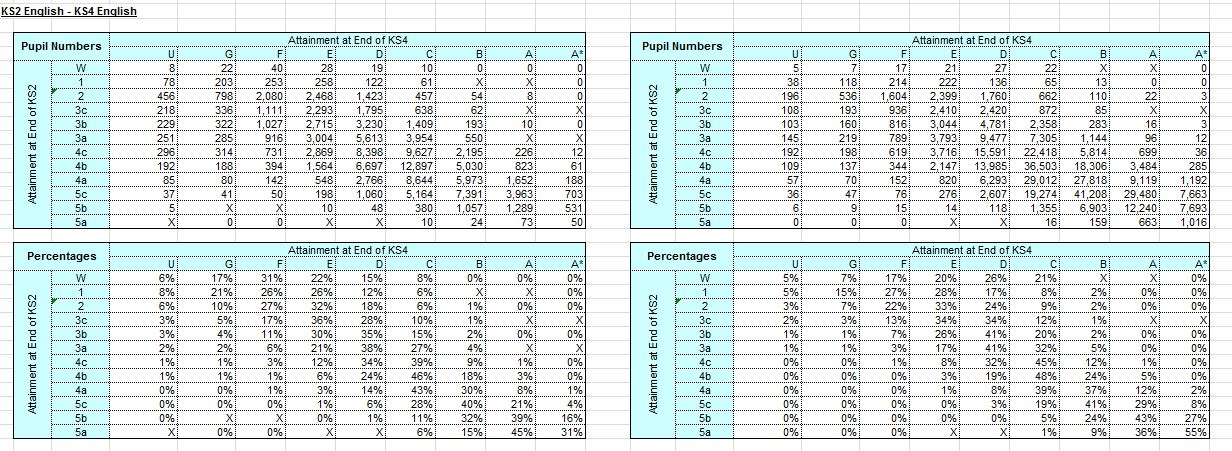
The 2014 matrices for English show that:
- Only 50 disadvantaged pupils with KS2 L5a (31%) went on to achieve a GCSE A* grade, whereas 73 (45%) achieved Grade A, 24 (15%) achieved grade B and 10 (6%) achieved grade C. The remaining 3% recorded a D, E or U. Grade A was therefore the most likely outcome for disadvantaged pupils.
- By comparison, 1,016 non-disadvantaged pupils with KS2 L5a (55%) achieved an A* grade at GCSE, while 663 (36%) achieved grade A, 159 (9%) achieved grade B and only 16 achieved grade C. One or two only achieved a grade D or E and none were awarded a U. An A* grade was achieved by a small majority of the cohort.
- Hence the excellence gap for those achieving A* was a substantial 24 percentage points (55-31) while for those achieving A*/A it was nine points lower at 15 percentage points (91-76).
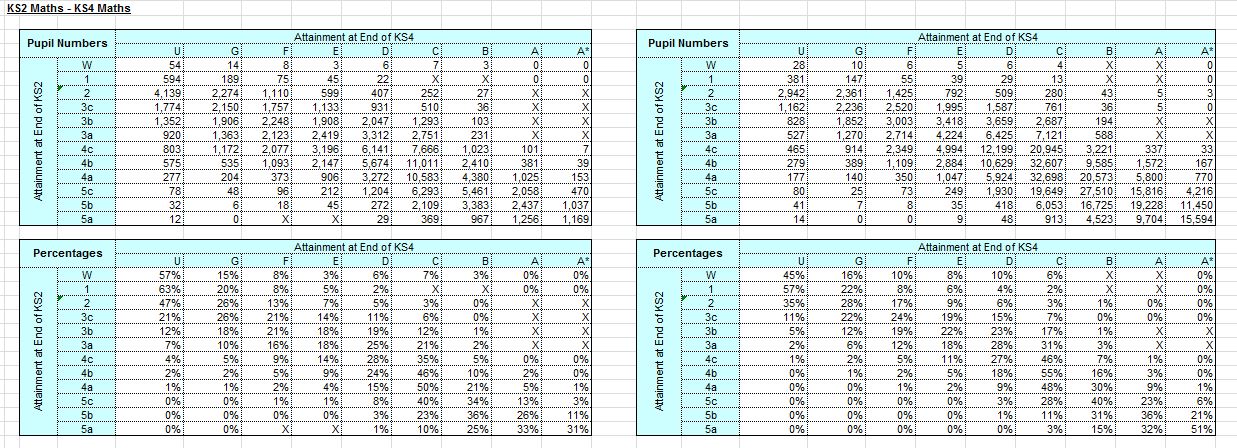
The 2014 matrices for maths reveal that:
- A substantially higher 1,169 disadvantaged pupils with KS2 L5a (again 31%) secured an A* grade at GCSE, while a further 1,256 (33%) achieved grade A, 967 (25%) achieved grade B, 369 (10%) achieved grade C and 29 (1%) were awarded a grade D. Small numbers were awarded an E or F grade and 12 were awarded a U. By a small margin, grade A was the most likely outcome for disadvantaged learners.
- In contrast, 15,594 non-disadvantaged pupils with KS2 L5a (51%) went on to achieve an A* grade at GCSE, while a further 9704 (32%) secured an A grade. There were also 4,253 (15%) awarded a B grade and 913 (3%) awarded a C. A further 71 received a D or E grade or were awarded U. So an A* grade was once more achieved by a small majority of the cohort.
- The numbers of high-attaining pupils in maths are much higher, with both the advantaged and disadvantaged populations far exceeding those in English. Indeed, the advantaged exceed the disadvantaged by a factor of around 20 in English and around 15 in maths.
- The excellence gap in maths for those achieving A* is lower than in English but still substantial at 20 percentage points (51-31). The corresponding gap for those achieving A*/A grades is 19 points (83-64), very similar to that for A* but also substantially higher than the equivalent gap for English.
Excellence gaps of this size – between 15 and 24 percentage points for both English and maths – reinforce the importance of targeted support through pupil premium for disadvantaged high attainers.
The table below summarises the data from the same two transition matrices for each of the four years, showing the percentage of those with KS2 L5a achieving a GCSE A* grade only.
.

.
It shows that, while totals have fluctuated to some extent, the ratio between the number of successful advantaged and disadvantaged learners in maths remains broadly consistent at around 15:1. The same is true of English, where the ratio is closer to 20:1.
However, the ratio between the number of disadvantaged pupils successful in maths and English has changed significantly over the period.
In 2011 it was roughly 6:1 in favour of maths, rising slightly to 7:1 in 2012 before extending to 10:1 in 2013 and reaching a colossal 23:1 in 2014.
Over the four-year period, the percentages of successful students have remained broadly stable, with the exception of disadvantaged learners in English.
There was an obvious and explainable fall in success rates in 2012, for advantaged and disadvantaged alike, but while the advantaged learners more than recovered in 2013 and 2014, the percentage of successful disadvantaged students in 2014 plunged back to the 2012 level.
These two graphs show the trend in excellence gaps at A* over the four year period, for English and maths respectively.
.

.

.
While the gap in maths has remained consistent at a substantial 19-21 percentage points, the gap in English has risen from a comparatively respectable 12 percentage points in 2011, peaking at double that rate in 2014.
Even with such tiny cohorts, excellence gaps of this size are concerning, suggesting that pupil premium is not yet having any substantive impact at the extreme top end of the attainment spectrum.
It is more alarming that the excellence gap for learners with KS2 L5a achieving GCSE A* in English has doubled in four years and now comfortably exceeds the corresponding gap in maths.
If we look at the A*/A grade excellence gap in English for this population the trend is somewhat less disturbing, in that the excellence gap has remained between 11 and 15 points throughout the period.
However, the A* trend suggests that something is going seriously amiss with either the teaching or the assessment of the very highest attaining disadvantaged learners in English. It hints that too many schools are content with an A grade outcome for these exceptional students.
.
TD
October 2015


Leave a comment